立即与支持人员聊天
与支持团队交流

Foglight for OpenStack 5.6.15 - User Guide

Using Foglight for OpenStack Interacting with Foglight for OpenStack dashboards Reference

Action panel

Figure 42. Action panel

Agents view

Alarm Analytics tab

This tab is available in the OpenStack Explorer. To find it, open the OpenStack Explorer and on the Topology tab that appears on the navigation panel, select a Host, Instance, or Volume. In the OpenStack Explorer, open the Alarm Analytics tab.
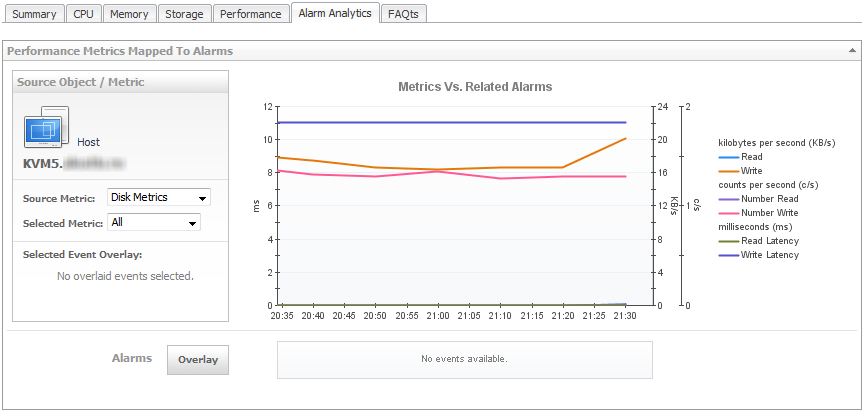
The Alarm Analytics tab displays resource-related metrics collected about a Host, Instance, or Volume over a selected time period, and also shows any events that occurred during that time frame.

CPU tab

This tab is available in the OpenStack Explorer. To find it, open the OpenStack Explorer and on the Topology tab that appears on the navigation panel, select a host. In the OpenStack Explorer, open the CPU tab.
Figure 44. CPU tab
2
Click the Apply button on the embedded view task bar.
相关文档

The document was helpful.

选择评级

I easily found the information I needed.

选择评级