It is possible to manually edit the settings in the instrumentation.config file instead of using the GUI editor. If you are comfortable and familiar with these settings from previous versions of Foglight for Java EE Technologies, you may prefer to use the text editor.
The default instrumentation level is FullDetail. At full detail level, request monitoring can be enabled and, when single traces are collected, all nodes in the call tree are included. This level provides the most flexibility in terms of request monitoring and single trace collection and should be acceptable for most customers.
If you require request monitoring, but do not require full detail single traces, instrumentation can be set to Component Detail. At component detail level, you can enable request monitoring, but when single traces are collected, they are collected at only the component technology detail level, reducing the complexity of the call tree. This level is more restrictive in what information can be collected for single traces, but reduces both the agent overhead on the monitored server and the load on the Management Server.
If you require request monitoring but only require request metrics for HTTP, JMS, and RMI requests, instrumentation can be set to Basic Detail. At this level, no breakdowns are collected and, if single traces are collected, only HTTP, JMS, and RMI nodes are included in the Request Trace call tree. No other component or full detail methods are collected, therefore reducing both the agent overhead on the monitored server and the load on the Management Server, compared to the
Component Detail instrumentation level.
If you do not require request monitoring or the ability to capture single traces, instrumentation for this purpose can be disabled by setting the instrumentation level to No Detail. At this setting, request monitoring cannot be enabled and you are unable to capture single traces at any detail level. This removes instrumentation overhead on the monitored server and greatly reduces load on the Management Server.
If you manually edit the instrumentation.config file, use the following syntax to set the instrumentation level:
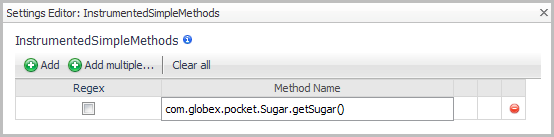
If you manually edit the instrumentation.config file, use the following syntax to enable simple method instrumentation: