立即与支持人员聊天
与支持团队交流

Quest VROOM 1.3 - User Guide

Using Quest VROOM Dashboard

Quest® VROOM accelerates the performance of your entire virtual infrastructure, transforms the application experience for users, and helps you control license and hardware costs. Go way beyond simple Hyper-V and VMware monitoring by maximizing resource utilization and improving virtual application performance across hybrid environments.

The Quest VROOM Dashboard User and Administration Guide is intended for users:

Rapid Recovery: Who belong to the Administrators group of Rapid Recovery Core Server and have been assigned either of the System Administrator, Advanced Operator, Capacity Management Administrator, VMware Administrator, or VMware QuickView User role.
Veeam Backup Enterprise Manager: Who have been assigned either of the Portal Administrators, Portal Users, or Restore Operators role.

This section introduces you to the Quest VROOM environment, and provides you with essential information.

For more information, see the following topics:

Installation requirements

Quest VROOM Dashboard comes installed on Foglight for Virtualization, Enterprise Edition and can be installed on a Foglight Management Server.

Quest VROOM Dashboard requires the following cartridges for data collection.

While Foglight for Virtualization, Enterprise Edition comes with these cartridges pre-installed and enabled, a stand-alone Foglight release requires that these components be installed on the Foglight Management Server. The sequence of cartridge installation is important because of their dependencies. For more information about installing Quest VROOM Dashboard, and for details about system requirements and version compatibility, see the Quest VROOM Dashboard Release Notes.

Dashboard location and UI elements

After installing Quest VROOM Dashboard, the Protection entry appears under Homes.

To access the Protection dashboard:
3
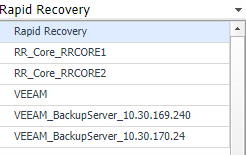
On the navigation panel, under Homes, click Protection.
The Protection dashboard opens.

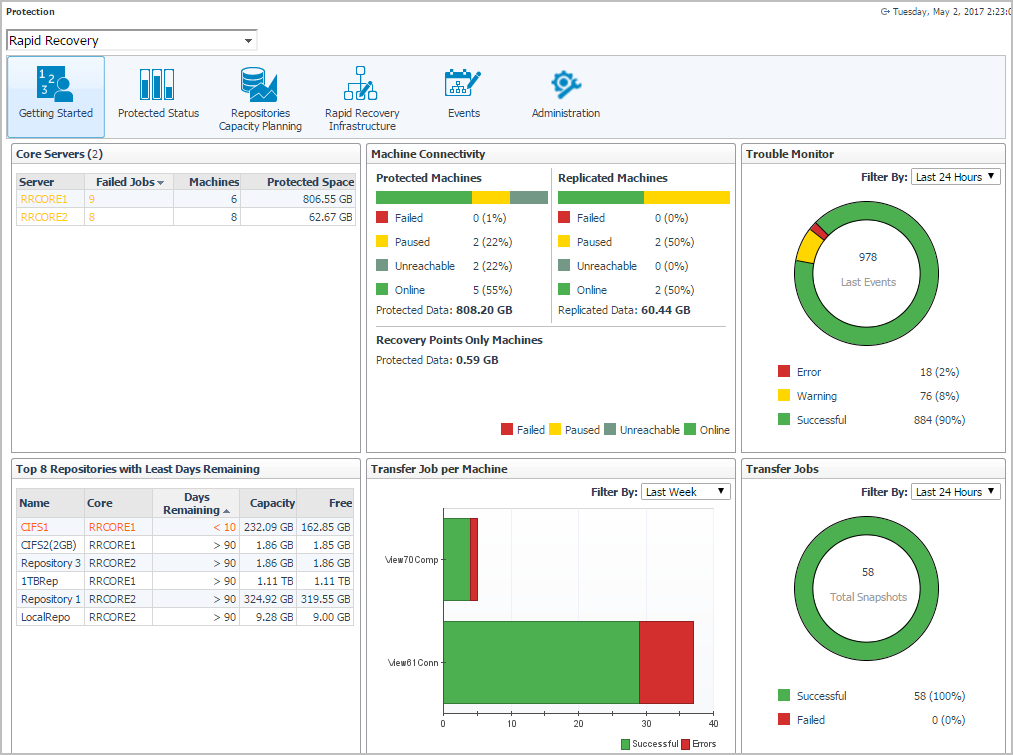
The Protection dashboard consists of the following UI elements:

Group selector

The Group selector is located at the top of the dashboard and allows you to select the Protection environment that you monitored.

Figure 1. Group Selector

自助服务工具
知识库
通知和警报
产品支持
下载软件
技术说明文件
用户论坛
视频教程
RSS订阅源
联系我们
获得许可 帮助
技术支持
查看全部
相关文档

The document was helpful.

选择评级

I easily found the information I needed.

选择评级