What Do The "Error Bars" Represent?
The "error bars" in the Resource Utilization bar chart in the What Database Resources Are Needed? page show the height of the Prediction Interval for each resource (CPU, Memory, and Disk I/O) at either a hypothetical load OR at a given time.
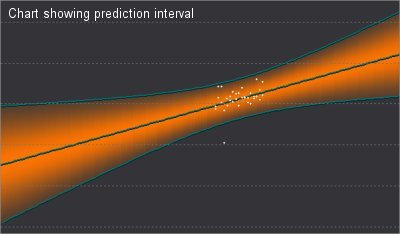
In a Predictive Diagnostics chart, the central prediction line is the line that best fits the raw data points (shown below as white).
The orange band is the prediction interval that (by default) indicates where 95% of measured values are expected to reside. The factors that determine the size of the prediction interval are:
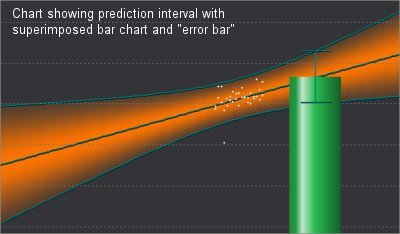
The second image superimposes part of the corresponding Resource Utilization bar chart, where the "error bar" represents the size of the prediction interval at the selected point.
How Does Raw Data Vary In Resource utilization Charts; What Is The Uncertainty In Predicting Behavior?
You can investigate how the raw data can vary in a Resource Utilization chart by using the Information panel at the right of the What Database resources are needed? page.
Click the Show Details link for a resource (CPU, Memory, or Disk I/O) in the information panel on the right side of the screen. The Show Details text indicates the raw data that is used to generate the prediction for the resource: the database throughput metric, the database concurrency metric, or a combination of both.
For example, if the text says Disk I/O (Latency) is moderately affected by Logical Reads per second, logical reads alone are being used to predict the (hypothetical) disk latency.
Open the Why will database resources reach their ceiling? page for the resource of interest and view all the charts that show the raw data used to predict the resources utilization.
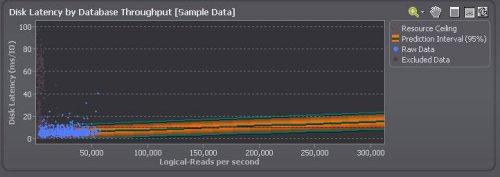
In the given example, the Disk I/O (Latency) prediction is based solely on logical reads per second, so view the chart of Disk Latency against Logical Reads per second. The variation of this raw data determines the size of the prediction interval.
In the example, the raw data in the Disk Latency chart extends only as far as 55,000 logical reads per second, but the predicted disk latency is plotted for values as high as 300,000 logical reads per second.
At these higher values, the width of the prediction interval increases — slowly, in this case — reflecting the lack of precision caused by the distance from the raw data. Significant flaring of the prediction interval would have made a prediction at this point unrealistic.
How Can I Reduce The Size of The "Error Bars"?
To reduce the size of the uncertainty in the Resource Utilization chart, reduce the size of the prediction interval in the charts that contain the original analysis.
|
Reduce the variation in raw data |
Where the variation of data in a chart contributes to the initial width of the prediction interval:
|
|
Reduce the uncertainty in predicting behavior |
Where there is flaring in the size of the prediction interval:
|
