Predictive Diagnostics uses the past performance of the specified database to predict its future performance.
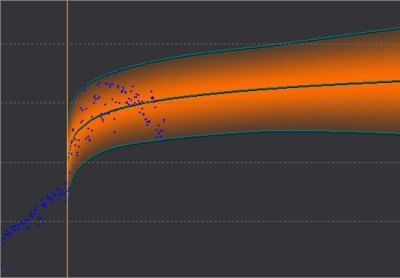
The results are displayed on charts for SQL Performance, Impending Bottlenecks - Timed Statistics or Performance Modeling as Prediction Interval that show not only future predictions but also the level of confidence we can put in those predictions.
The main assumption we make with these predictions is that the trends they depend on have not changed. However, if the trends HAVE changed — if, for example...
...the predictions may become less accurate.
To protect the accuracy of a prediction, you can mark where such trend changes occur on the chart with a vertical line. When you do so, Predictive Diagnostics will re-calculate its predictions. The image below illustrates the predicted behavior where a user has identified a trend change — but only the section of chart to the right of the trend change line is used to make predictions.
Notes:
There are two types of trend changes within Predictive Diagnostics:
|
Specific |
Trend changes within SQL Performance apply only to the specified chart for the selected SQL statement. |
|
Global |
Trend changes within Impending Bottlenecks and Performance Modeling apply globally to ALL time-based charts for timed statistics and database resources. |
Sometimes a chart will display the (blue) raw data points only, without a Prediction Interval. In this case, Predictive Diagnostics cannot find a trend — there may be no statistical correlation between the data points, or there may not be enough data to give a reliable prediction.
