Chat now with support
Chat with Support

Spotlight on Oracle 10.4 - Release Notes

Spotlight Home Pages

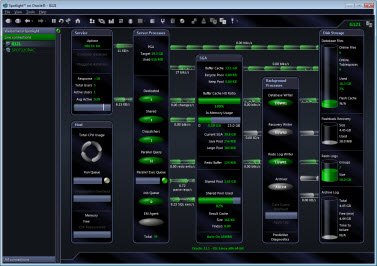
The Spotlight Home Page is the main page for the monitored system. It highlights obvious bottlenecks and problem areas. Statistics and flows are updated in real time.

Show the Spotlight Home Page for each connection:

About Spotlight home pages

  • The connection identifier in the upper right corner of the Spotlight console identifies the system being monitored. Alongside the connection identifier there may be additional icons. The following activity icon indicates whether Spotlight is collecting data from the connected system.

  • The home page can show real (live) data or a historical snapshot. When the home page is showing a historical snapshot the words History Browser are written in the bottom left corner of the console and the recorded date and time are shown in the top right corner. History Browser
  • A panel is a visual feature that groups related components on the Spotlight home page. Panels may be connected by data flows that illustrate the rate at which the system is performing. The groupings reflect how your system works. Components change color as alarms are raised for the metrics they contain. Spotlight Home Page Components


Related Topics

Calibrate Spotlight Connections

Related Documents

The document was helpful.

Select Rating

I easily found the information I needed.

Select Rating