Chat now with support
Chat with Support

NetVault 13.0 - Administration Guide

Introduction Getting started Configuring clients Managing catalog search Configuring storage devices
About storage devices SAN considerations Quest DR Series systems Quest QoreStor NetVault SmartDisk EMC Data Domain Systems Snapshot Array Manager Virtual Tape Libraries Virtual standalone drives Shared Virtual Tape Libraries Physical tape devices Storage tiers
Backing up data Managing policies Restoring data Managing NetVault dashboard Managing jobs Monitoring logs Managing storage devices
Monitoring device activity Managing disk-based storage devices in list view Managing disk-based storage devices in tree view Managing the Snapshot Array Manager Managing tape libraries in list view Managing tape libraries in tree view Managing tape drives in list view Managing tape drives in tree view Adding shared devices
Managing storage media Managing user and group accounts Monitoring events and configuring notifications Reporting in NetVault Working with client clusters Configuring default settings for NetVault
About configuring default settings Configuring encryption settings Configuring plug-in options Configuring default settings for post-scripts Configuring default settings for Verify Plug-in Configuring Deployment Manager Settings Configuring Job Manager settings Configuring Logging Daemon settings Configuring Media Manager settings Configuring Network Manager settings Configuring Process Manager settings Configuring RAS device settings Configuring Schedule Manager settings Configuring Web Service settings Configuring Auditor Daemon settings Configuring firewall settings Configuring general settings Configuring security settings Synchronizing NetVault Time Configuring default settings for global notification methods Configuring the reporting utility Configuring NetVault WebUI default settings Configuring NetVault to use a specific VSS provider Configuring default settings using Txtconfig
Diagnostic tracing Managing diagnostic data Using the deviceconfig utility NetVault processes Environment variables Network ports used by NetVault Troubleshooting
Common errors
NetVault Service fails to start on Windows NetVault Service fails to start after the machine is restarted NetVault Service starts, but stops immediately on Linux Login fails after any change in the server IP address Unexpected behavior of NetVault WebUI WebUI does not run in Compatibility View in Internet Explorer NetVault installer fails during push installation VSS-based backup fails Modifying TCP/IP socket buffer size on Windows Restores using Data Copy savesets fail on clients running NetVault 10.0.1 Restore fails on Itanium platforms if the index is larger than 2GB After upgrade, Data Copy and Consolidated backup job on Linux fails After upgrade, console error is displayed on WebUI pages Deployment task hangs on target Linux machine during push installation. Unable to add package store with hostname. Deployment task fails due to network configuration issues. Domain user is unable to login NetVault Server if the workstation attribute is set. Domain user is unable to login NetVault Server on Debian 9. Adding the target machine as a client fails, after successful push installation. Unable to install, uninstall or navigate catalog search page after manually uninstalling NetVault Client Host. Unable to install, uninstall catalog search on client after NetVault Server migration with the same or different server name External Azure AD user cannot add an external Azure AD user to NetVault Server Failed to verify target Windows machine from a Linux-based NetVault Server NetVault is unable to send reports as an email attachment in PDF format on RHEL 5.x platform Restore fails on NetVault Database backup When using RDA for backups, only four streams are used at once Unable to create large VTL on Linux Browsing a folder with a large number of files times out
Safe Mode in NetVault

Using notification methods to send reports by email or print reports

You can configure user-defined events for a report job and receive notifications when a job completes successfully or fails. NetVault adds these events to the Report Job event class. You can use this feature to send reports by email or to send the reports to a designated printer.

Depending on whether you want to distribute the report by email or print the report, do the following:

To send the report to the Administrator, set up the Sysop E-mail notification method. For more information, see Setting up a global notification method. By default, the report is generated in PDF file format and delivered as an email attachment.
To print the report, set up the Print a report notification method. For more information, see Setting up a global notification method.

Customizing table views for reports

After a report is generated, you can modify the table views to include or exclude columns, change the column order, and add column totals and other aggregate values. You can add multiple table views for a component. The reporting system lets you save these settings to the job definition so that the custom format is used every time you run the report.

2
In the report window, click the Settings link at the upper-right corner of the table. If the report contains multiple components, click the link associated with the table that you want to modify.
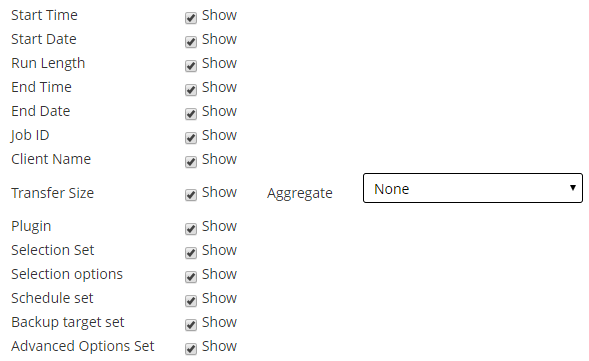
3
In the Table Settings dialog box, the available columns are listed. The columns that have the corresponding Show check box selected are included in the table view. For example, the following Table Settings dialog box is displayed for the report- Data Stored By Client.
Hide columns: To hide one or more columns, clear the check marks for those columns.
Show columns: To show hidden columns, click the corresponding Show check boxes.
Display aggregate values: To add fields that display the total, minimum, maximum, and other aggregate values for the columns, select the field type in the Aggregate list. This list is only displayed for columns that contain numeric values.
Total: Displays the sum of all the values in the column.
Average: Displays the average value of all the values in the column.
Min: Displays the maximum value of all values in the column.
Max: Displays the minimum value of all values in the column.
Count: Displays the count of records.
None: Removes the aggregate field.
Click Apply to apply the settings to the table view and close the dialog box.
6
To add a table, click the Add another view link at the lower-left corner of the component table.
If the component only supports table views, a new table is automatically added. If different view types are supported, then the Add a view dialog box is displayed. To add a table, select Table in the Type of view list.
7
To remove a view, click the Remove this view link at the lower-left corner of the component table.
8
To save the custom settings, click the Save report format link at the upper-left corner of the report.

Adding charts to reports

You can use the graphical capabilities of the reporting system to view the output in the form of bar charts and pie charts. You can use multiple chart views to compare different sets of data. The reporting system lets you save these settings to the job definition so that the custom format is used every time you run the report.

2
In the report window, click the Add another view link at the lower-left corner of the table. If the report contains multiple components, click the link associated with the component for which you want to add a chart.
The Add a view dialog box is displayed if the component supports graphical views.

Bar charts

You can use bar charts to provide a visual comparison of data values.

To add a bar chart, do the following:

In the Type of view list, select Barchart.
In the Category list, select a column to represent the vertical axis. A bar is generated for each record in the category column. The column values are used as labels.
In the Value list, select a column to represent the horizontal axis. The data values determine the length of the bars.

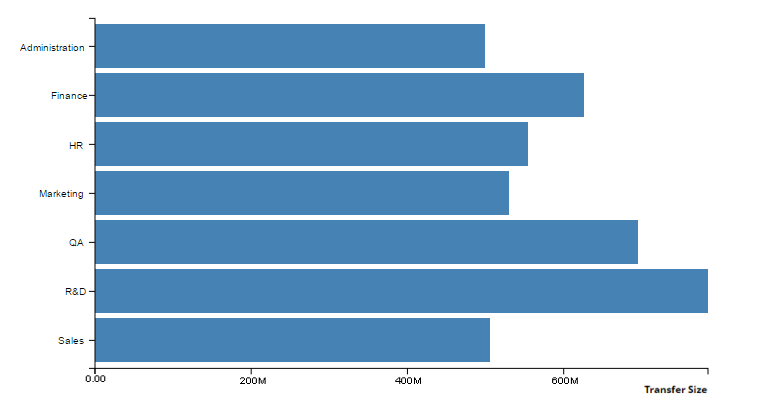
Click OK.

Figure 32 displays a bar chart view.

Pie charts

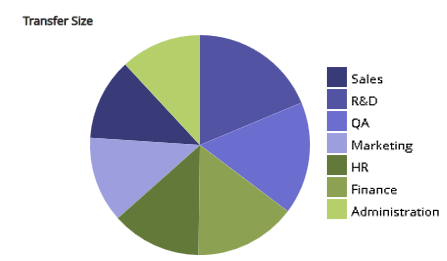
You can use pie charts to show the relative contribution of different categories to the total.

To add a pie chart, do the following:

In the Type of view list, select Piechart.
In the Category list, select a column to represent the categories or parts of the pie. The number of records in the category column determines the number of slices in the chart. The column values are used as legends.
In the Value list, select the column that contains the data for the pie chart. The data values determine the size of the slices.

Click OK.

Figure 33 displays a pie chart view.

4
To remove a view, click the Remove this view link at the lower-left corner of the component table.
5
To save the custom settings, click the Save report format link at the upper-left corner of the report.

This section includes some sample charts generated using the reporting system.

The following figure displays the bar chart view for a sample data set.

Figure 32. Bar chart view

The following figure displays the pie chart view for a sample data set.

Figure 33. Pie chart view

Exporting reports to PDF files

After a report is generated, you can choose to export the report to a PDF file. The file is displayed in a browser window. You can download, save, or print the file, as required.

2
In the report window click the Export as PDF link at the upper-left corner of the report.
Related Documents

The document was helpful.

Select Rating

I easily found the information I needed.

Select Rating