Monitoring StoragePoint Timer Job Performance
If Metalogix Diagnostic Manager detects that StoragePoint is deployed on a monitored farm, it will also monitor the performance of the StoragePoint timer job. By default, an alert will be triggered for the following events:
·Storage Point timer job execution time exceeds the alert threshold
·the collection of StoragePoint timer job data fails
·a StoragePoint timer job execution error occurs
StoragePoint Timer Job Data Collection
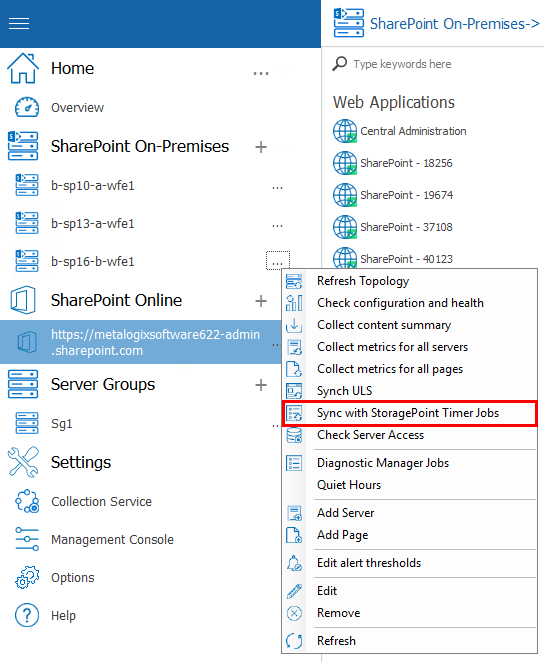
By default, Metalogix Diagnostic Manager collects StoragePoint timer job data every thirty (30) minutes. To collect this data immediately, select the (...) next to the farm in question, and select Sync With StoragePoint Timer Jobs.
|
|
NOTE: the synchronization may not be immediate, since it may take time for the SharePoint timer job to complete the collection of log entries from all servers in the SharePoint farm. |

To open the StoragePoint Dashboard in SharePoint Central Administration:
1.In the Management Console tree, double click the farm where StoragePoint is deployed.
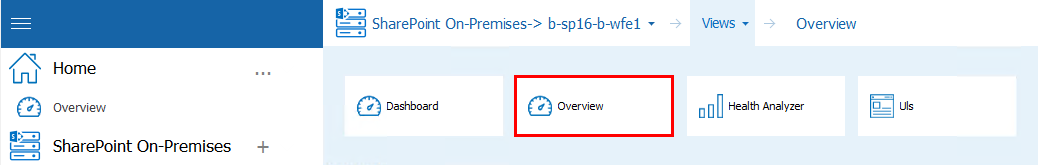
2.Select the farm name, above the overview pane, and select Views from the drop down.

3.Click Views and select Overview from the drop down menu.
4.On the Farm Overview page, click the StoragePoint Version link.
Viewing ULS Log Entries for a Farm
Metalogix Diagnostic Manager offers a built-in viewer that lets you review ULS log entries for SharePoint 2010, 2013, and 2016 On-Premises farms.
|
|
NOTE: This feature is not available for SharePoint 2007 farms or SharePoint Online tenants. |
To start using the Metalogix Diagnostic Manager ULS Log Viewer, the Diagnostic Data Provider: Trace Log timer job must be enabled in SharePoint Central Administration. You can enable the job and synchronize the schedules of all monitored farms via the Metalogix Diagnostic Manager Collection Service Options dialog (see Enabling and Configuring ULS Log Entries). In this dialog you can specify the frequency with which the Collection Service should gather ULS log data as well as how long ULS log data should be retained in the Metalogix Diagnostic Manager Repository database. You can also specify the maximum number of ULS Log entries to display in the Management Console via the Management Console Preferences dialog.
You also have the option of clearing ULS log entry history from the Repository database.
Prerequisites
·For the SharePoint timer job to collect ULS log data, usage and health data collection must be enabled in SharePoint. For details, refer to the applicable Microsoft Technet article:
For SharePoint 2016
For SharePoint 2013
For SharePoint 2010
·In order to use the Metalogix Diagnostic Manager ULS Log Viewer:
§the latest version of the Metalogix Diagnostic Manager Component Analysis Solution must be installed and deployed to every farm whose ULS log entries you want to view
§the Metalogix Diagnostic Manager ULS Synchronizer must be activated. (This feature is initially activated as part of the Component Analysis installation).
·Remember that the Collection Service account must have the appropriate VIEW permissions to the SharePoint Logging database. See the Account Requirements topic in the Metalogix Diagnostic Manager Advanced Installation Guide for complete Collection Service account requirements.
To view ULS log entries in Metalogix Diagnostic Manager:
1.In the Management Console, double click the farm whose ULS logs you want to view.
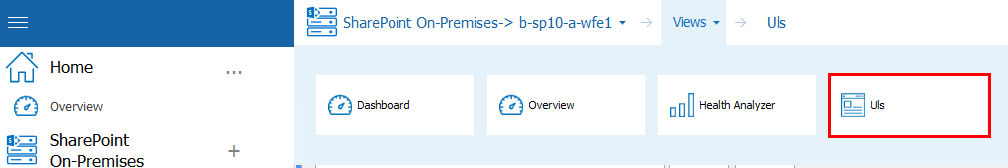
2.Select the name above the overview pane and from the drop down panel select Views.

3.Select Views from the top tab, and select ULS from the dropdown panel.
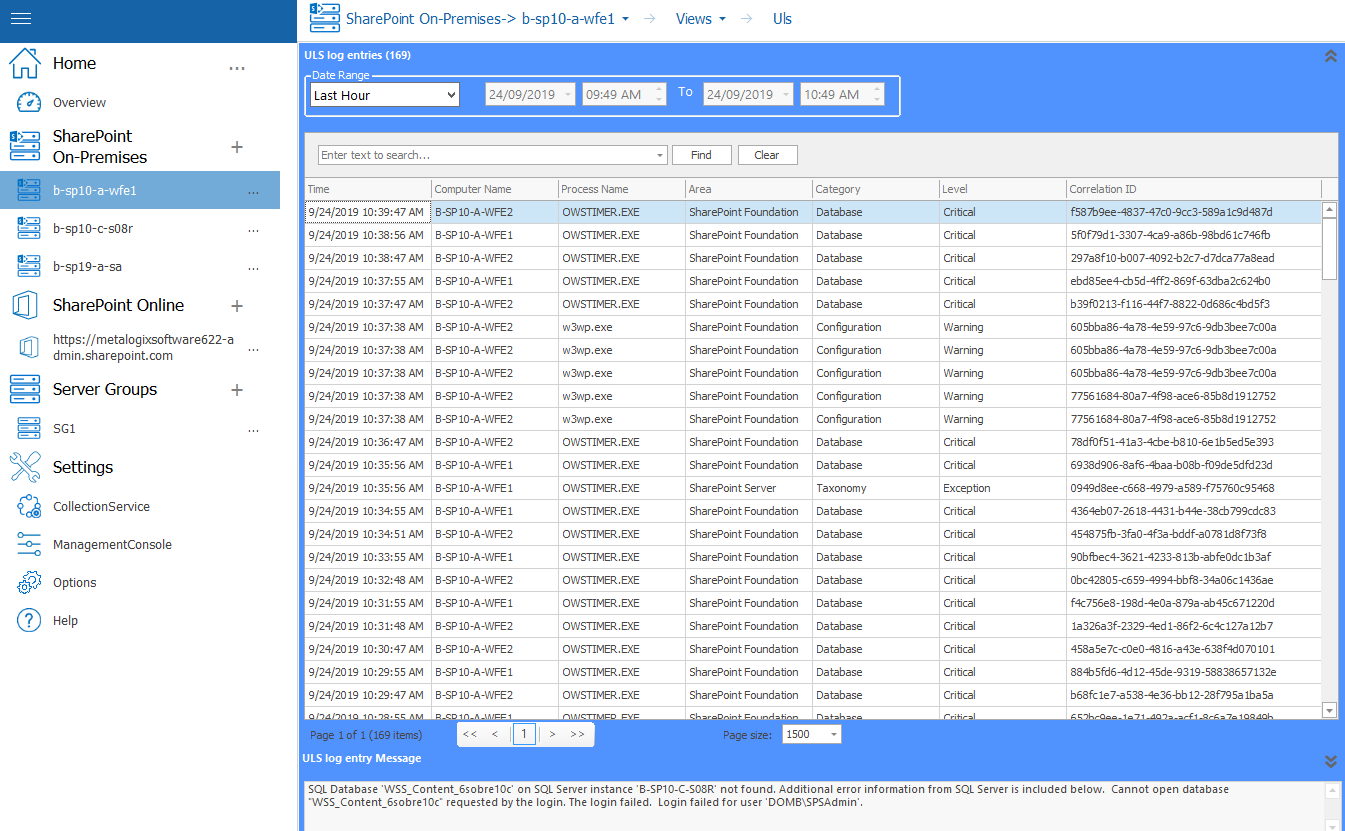
Note that when an entry is selected, the corresponding ULS log entry Message displays in the bottom panel.
Now you can:
·filter entries by Date Range
|
|
NOTE: Filter dates always display in the format dd/mm/yyyy, whereas dates in the Time column display in the format specified for the machine on which the Management Console is installed. |
·sort and filter entries by any of the column headers.
·group entries by a single column by right clicking and selecting Group by This Column.
·group entries by multiple columns by selecting any column, right clicking and choosing Show Group By Box, then dragging each of the columns by which you want to group to the area above the column headers.
·search on a text string by typing the string in the blank box and clicking [Find].
Note that you can use combinations of search, sorting, and filtering to help identify potential problems in SharePoint, as shown in the example below which uses filtering on date range and grouping by Correlation ID and Warning Level.
To initiate the immediate synchronization/gathering of ULS data for the selected farm:
Select the (...) next to a farm name, and select Sync ULS.
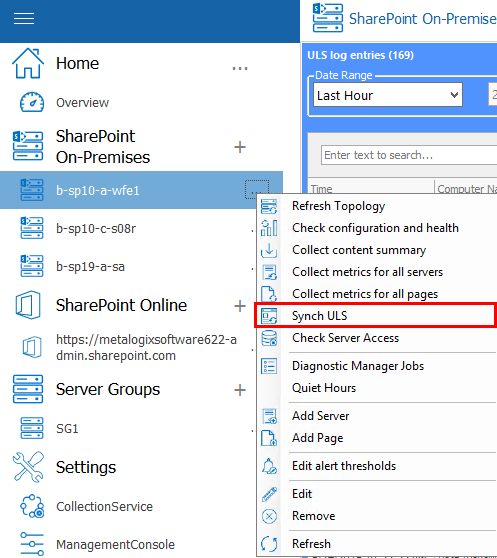
Note that the synchronization may not be immediate, since it may take time for the SharePoint timer job to complete the collection of log entries from all servers in the SharePoint farm.
|
|
NOTE: The regularly-scheduled synchronization and gathering of ULS log entries for all monitored farms is specified in the Collection Service Options dialog. |
Viewing the Status of Data Collection Jobs
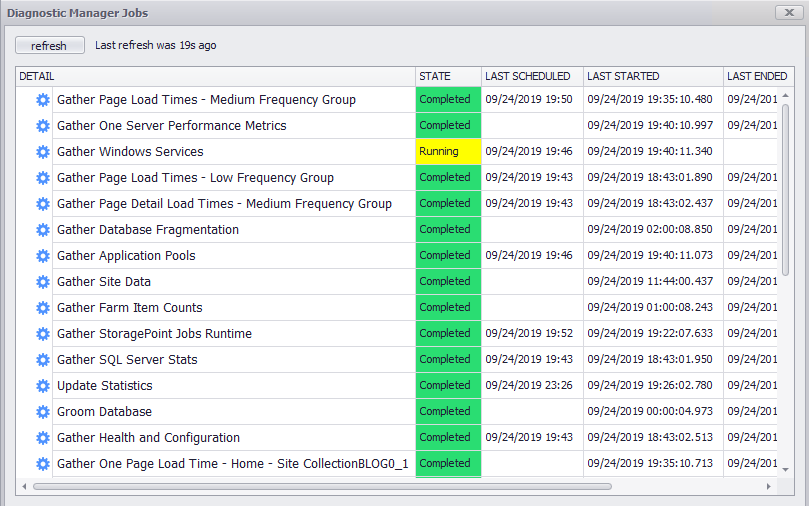
You can view the current status of all active data collection jobs in one or more farms including whether the job is currently Running, is Completed, or is Scheduled to run for the first time.
To view the status of data collection jobs:
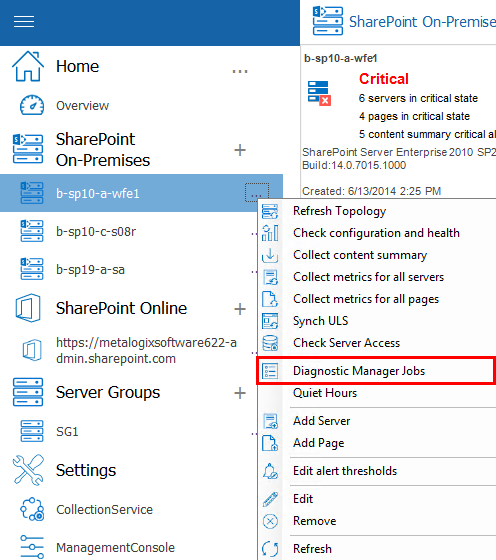
1. In the Management Console select the (...) next to either the Home section (to view all the Diagnostic Manager Jobs) or next to the farm whose specific Diagnostic jobs you want to view.
|
|
NOTE: If you want to view the status of all monitored farms, select the Home Page node. |
2.Select Diagnostic Manager Jobs from the drop down menu.
3.This will open the Diagnostic Manager Jobs window.
|
|
CAUTION: This feature is primarily intended for use by Quest Support for troubleshooting purposes. |

Viewing a Content Summary
You can use the Metalogix Diagnostic Manager Management Console to view a summary of the content on a monitored SharePoint farm. The Content view summarizes the content within the farm, Web application, and Site Collection. The Pages view lets you quickly review the monitored pages on the farm.
To view a Content Summary:
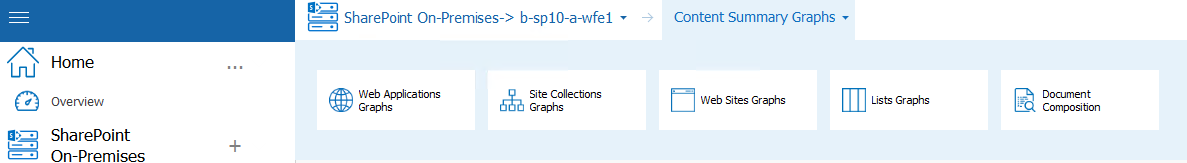
In the Management Console, select the farm whose content summary you want to view. Select the name above the overview pane and select Content Summary Graphs.

Now you can view a Content Summary for the Web Application, site collections, web sites, lists, and document composition.