Viewing a Content Summary for Individual SharePoint Objects
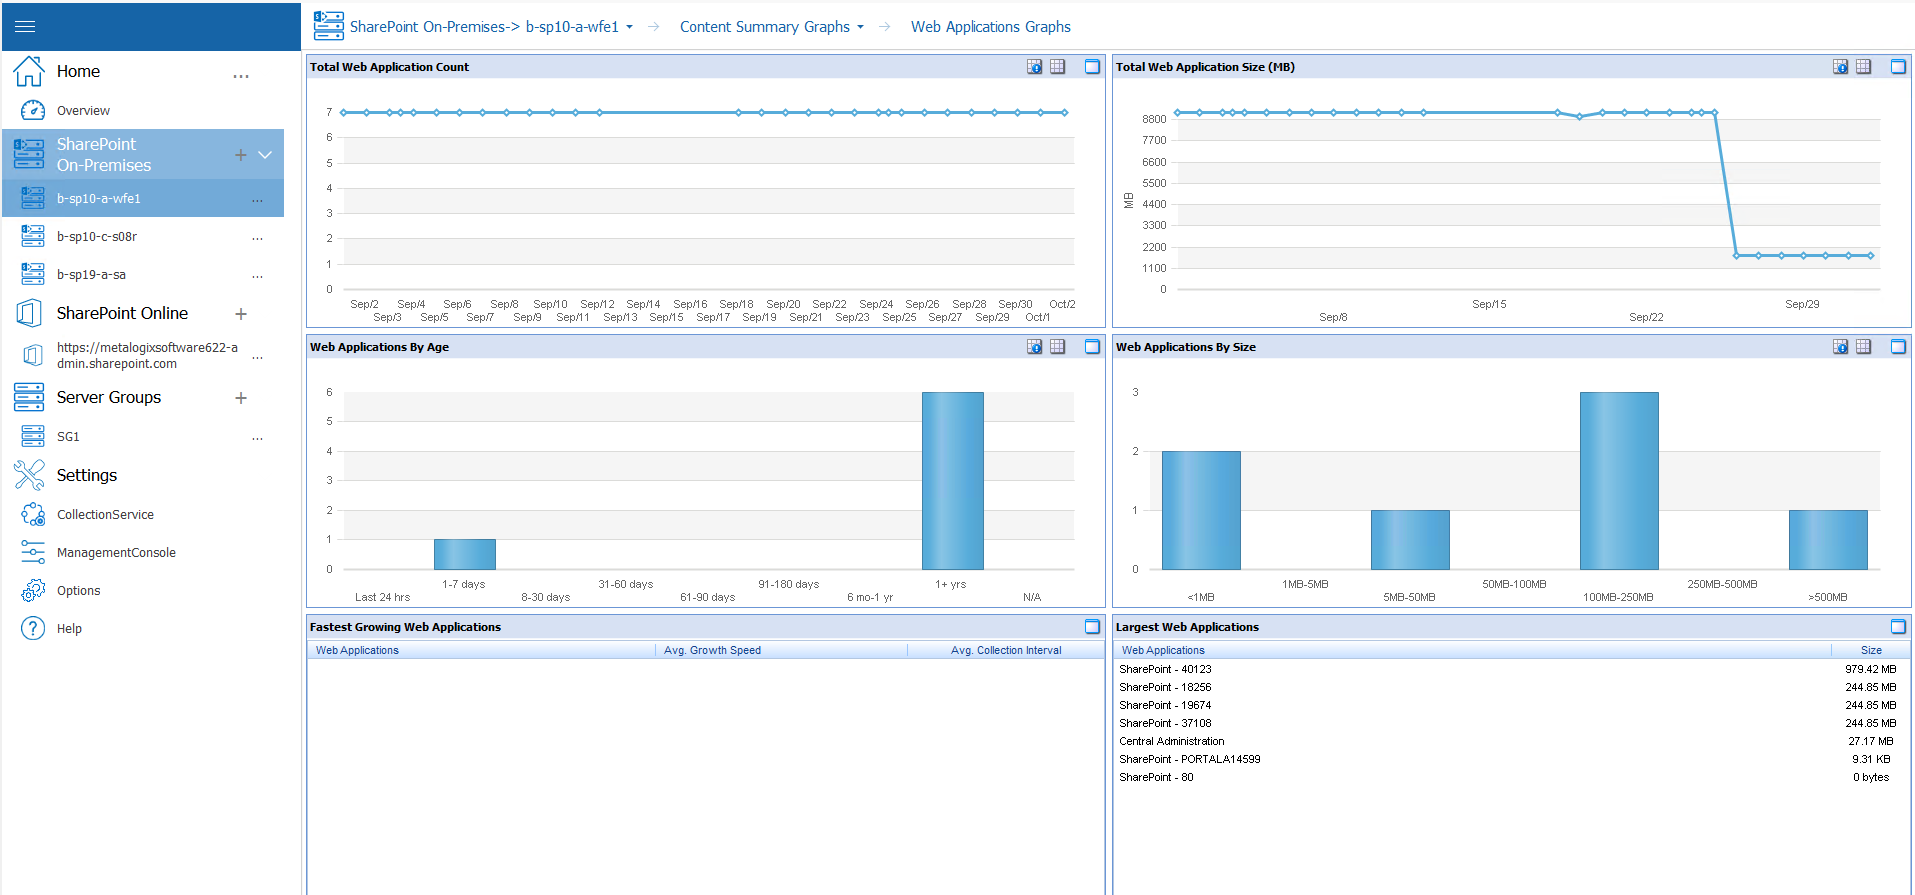
·If a farm was selected, summary information and statistics about the Web Applications that the farm hosts.
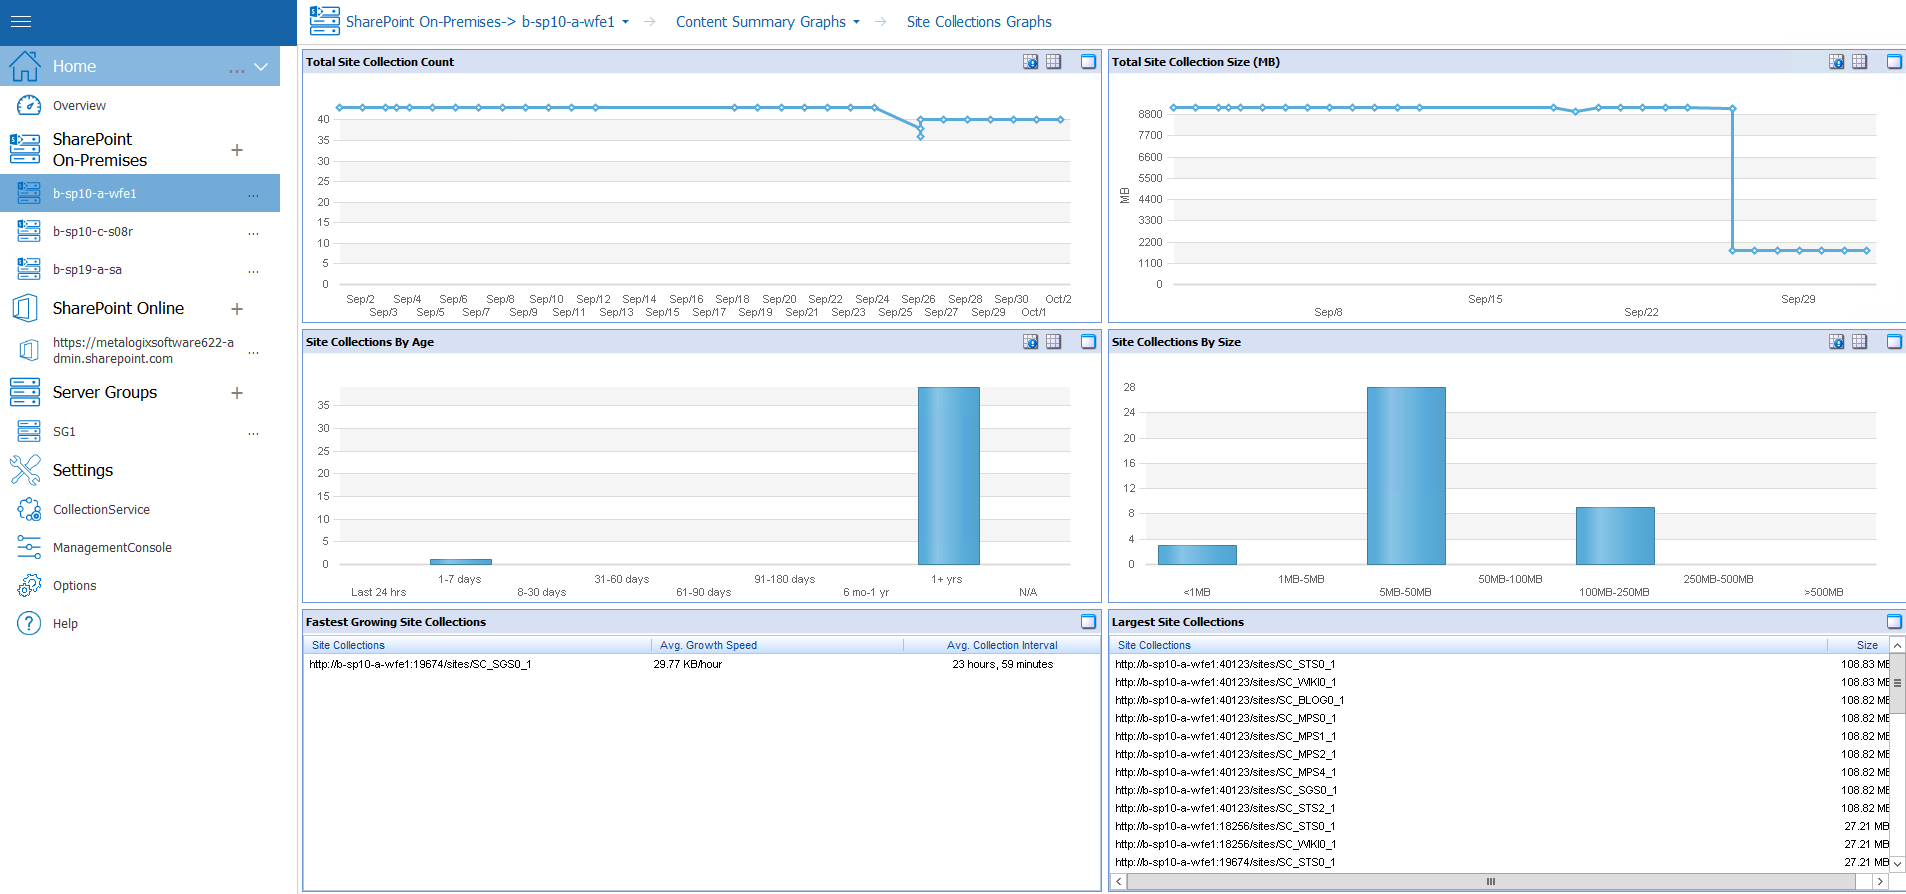
·If a farm or Web application was selected, summary information and statistics about the Site Collections that the farm or Web application hosts.
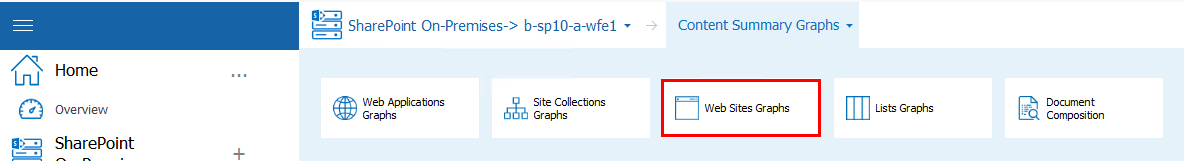
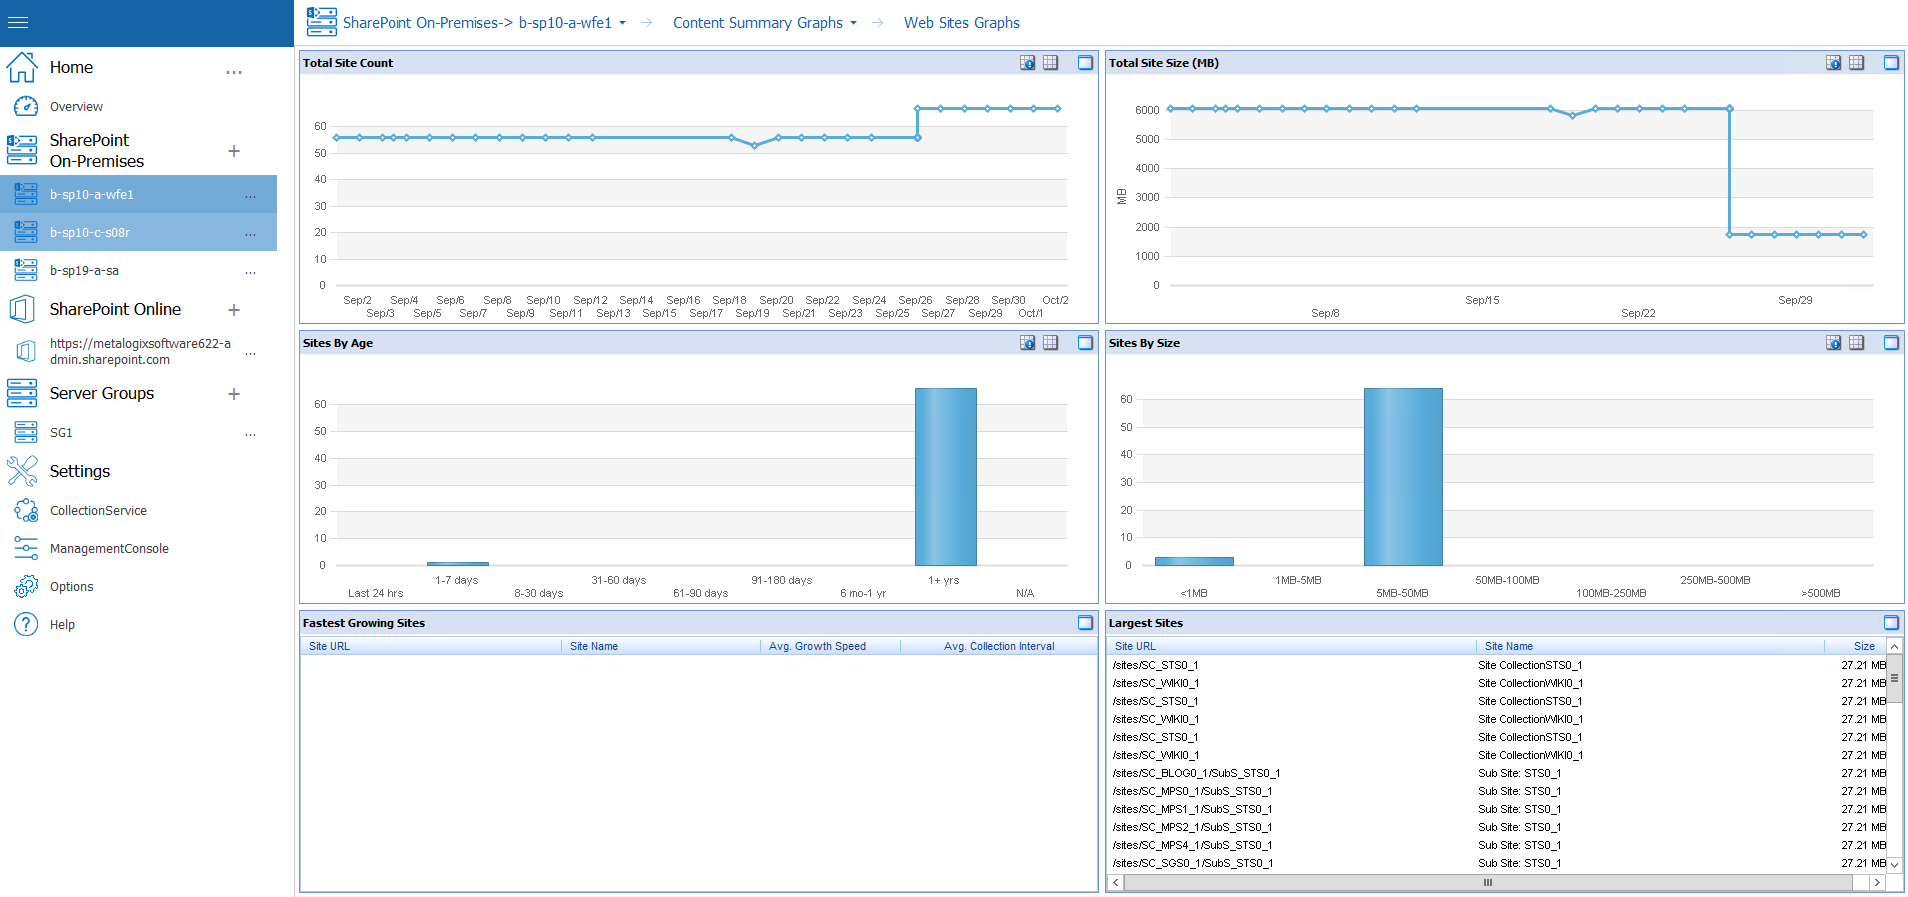
·Summary information and statistics about the Sites (Webs) that the SharePoint object hosts.
|
|
NOTE: Some users may receive an access denied message when attempting to use a content summary function on some sites. If this message appears, set up a Web application policy to grant global access to Metalogix Diagnostic Manager. This step allows you to override explicit security on the objects and grant read only access to the other service account used by Metalogix Diagnostic Manager. For more information about the Metalogix Diagnostic Manager permission requirements, see the Metalogix Diagnostic Manager Advanced Installation Guide. |

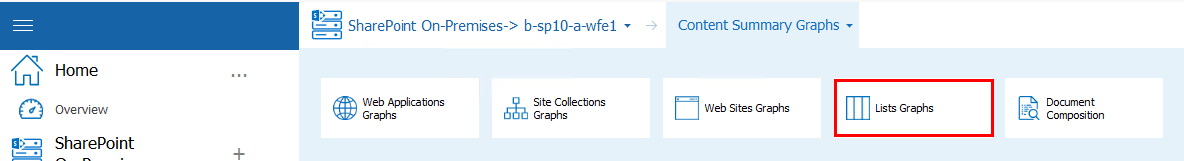
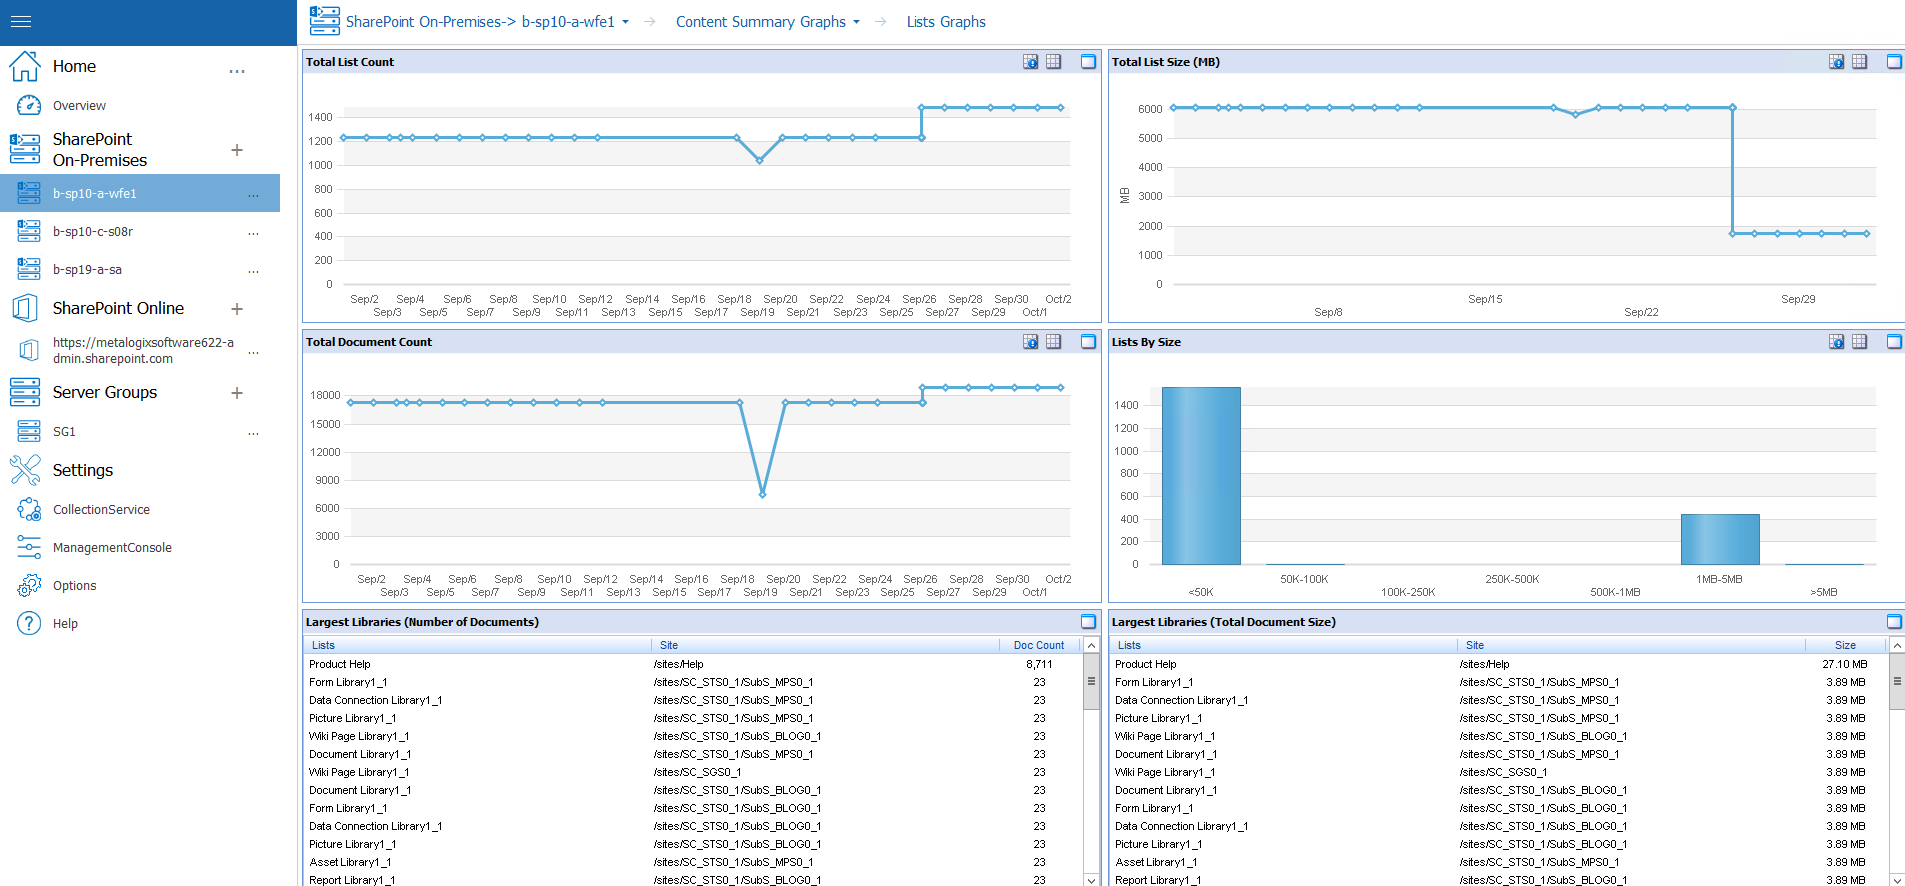
·Summary information and statistics about the Lists that the farm hosts.
|
|
NOTE: §Currently, Metalogix Diagnostic Manager collects content summary statistics about document libraries only, not other types of lists or files such as web parts and aspx pages. For improved performance, attachments and hidden libraries are excluded from data collection by default. You can, however, enable the collection of hidden lists and attachments. (See Content Summary Options.) § Metalogix Diagnostic Manager does not collect data for external lists (that is, lists for which features are built into SharePoint but data is stored in an outside source, like a database). |
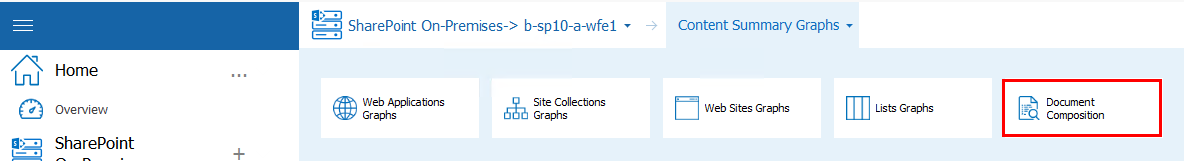
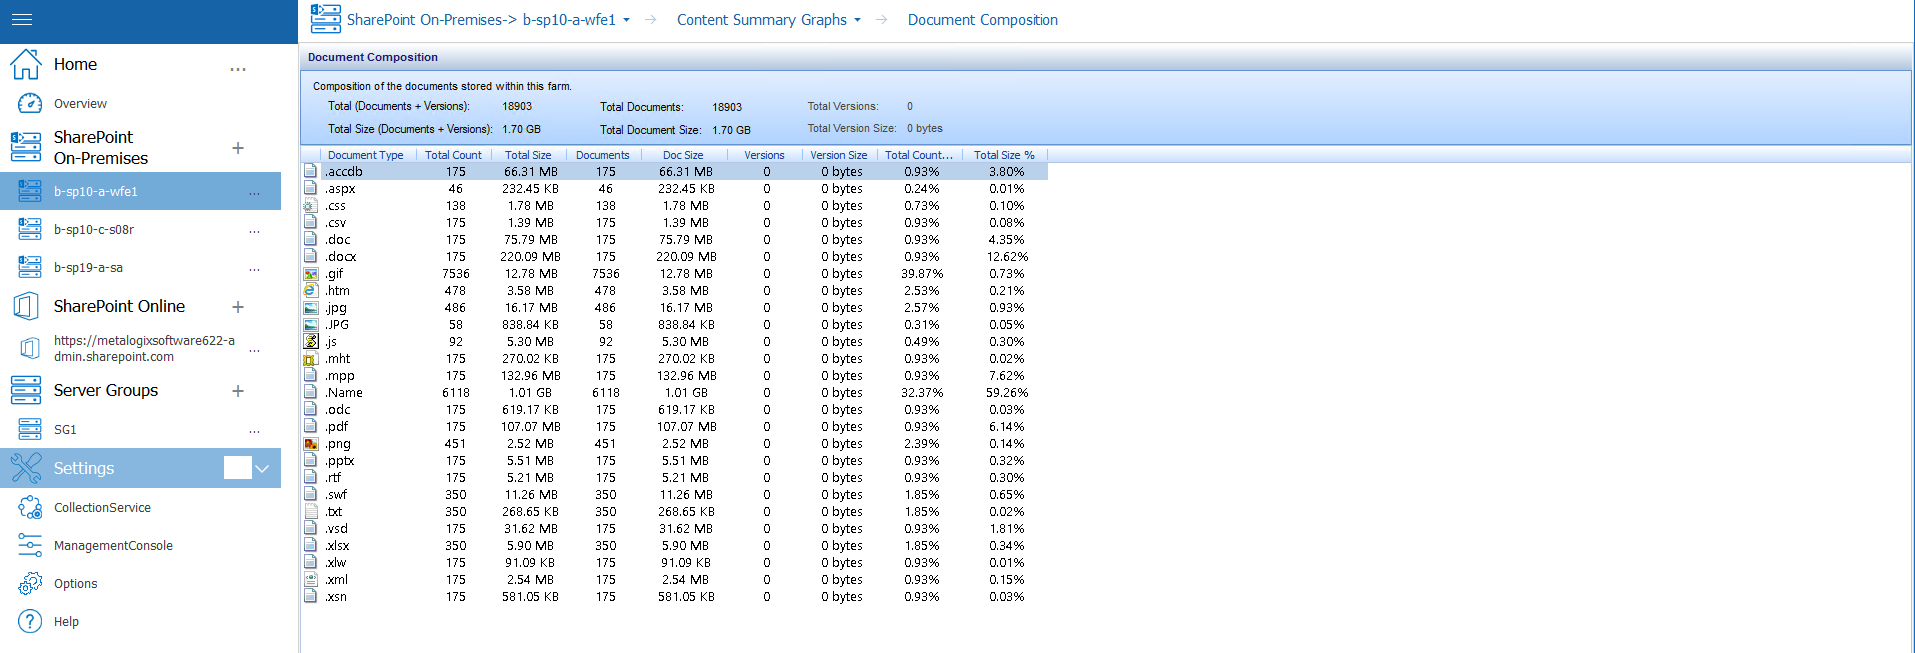
·Summary information about Document Composition (that is, the documents stored within the selected SharePoint object).
|
|
NOTE: If a document includes multiple versions, the latest version is counted as the document. Prior versions count as versions. |
For a farm-level Content Summary you can also:
·request immediate collection of farm content summary data
·edit alert thresholds for the farm.
Viewing a Content Summary for Monitored Pages
The Content Summary Pages tab contains information about the monitored pages on the selected SharePoint object, including:
·Page Title
·Page Address (URL)
·The current Status of the page.
·The alert status of the Load Time
·The alert status of the page Components
To filter pages by alert status:
In the Content Summary Pages tab, in the Filter area, click one or more of the following to display pages with that status:
·OK
·Warning
·Critical
·Disabled
To view page details:
1Select the page whose details you want to view.
2In the Content Summary section of the ribbon choose Pages >View Page Details.
Refreshing the Content Summary
Metalogix Diagnostic Manager refreshes the Content Summary on a schedule you specify (see Setting the Collection Service Options). If necessary, you can request a content summary update.
When it performs a content summary operation, the Collection Service examines the entire SharePoint farm and counts every object in the farm. The content summary operation is time consuming and can impact your farm performance. By default, the Collection Service only performs a content summary operation one time per day at 1:00 AM according to the server clock. When you manually start a content summary operation, the Collection Service starts the content summary operation immediately. The results may not appear in the Management Console until the content summary operation is complete, which may take several minutes or more. You can also request a more targeted (and less resource-intensive) content summary update for a single Web application or site collection.
When you request a content summary update, the Collection Service automatically refreshes the farm topology information.
To refresh the Content Summary for the entire farm:
Use one of the following options:
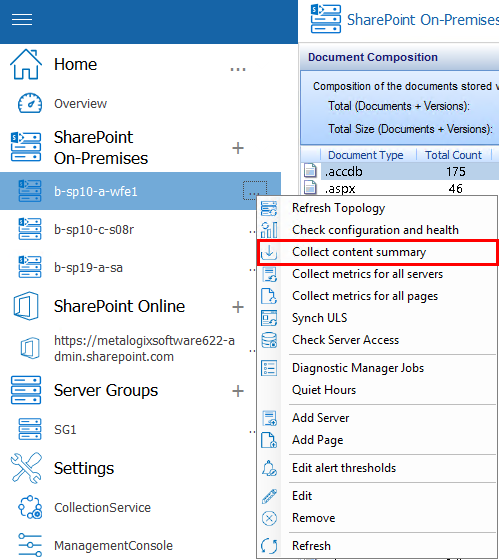
·In the Management Console, select the (...) next to the farm you want to update the content summary for, select Collect Content Summary from the drop down menu.
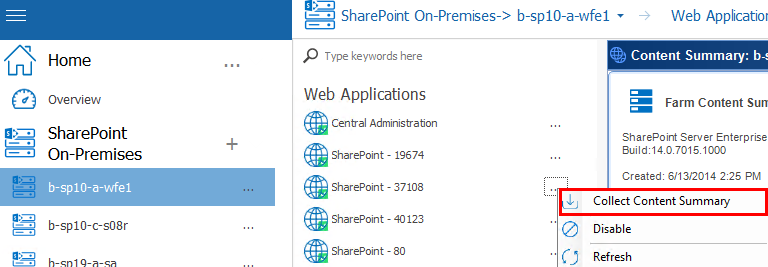
To refresh the Content Summary for a single Web application:
1From the Management Console, select a farm, and select Web Applications.

2Next to the web application you want to collect content data for, select (...) and select Collect Content Summary.
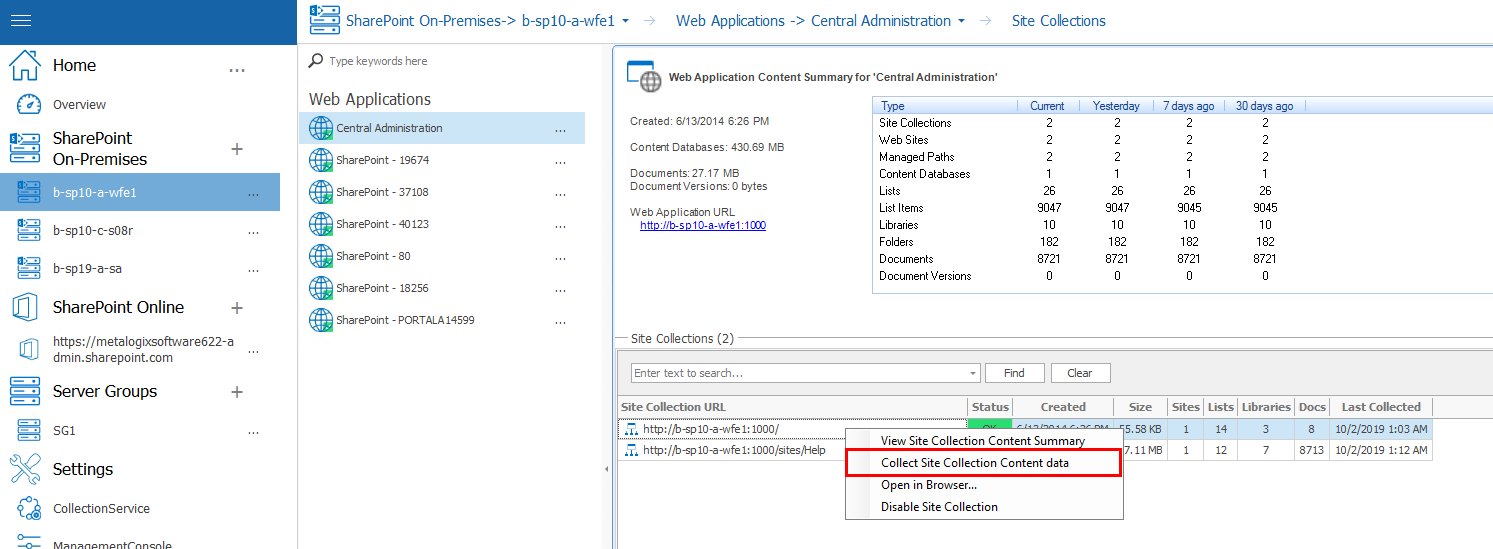
To refresh the Content Summary for a single site collection:
1From the Management Console, select a farm, and select Web Applications.
2Double click on the web application that contains the site collection you want to refresh.
3Select the site collection you want to refresh, right-click and choose Collect site collection content data.
Using the Web Dashboard to View Performance Data from Within a SharePoint Site
Metalogix Diagnostic Manager offers a Web Dashboard for a quick glance at the performance data collected by Metalogix Diagnostic Manager to help you monitor your SharePoint farms and pages. While this optional Dashboard is not installed with Metalogix Diagnostic Manager, it is provided in the SharePoint solution files located in the folder where Metalogix Diagnostic Manager was installed (by default C:/Program Files (x86)/Metalogix/Diagnostic Manager/WebDashboard.
To start using the Metalogix Diagnostic Manager Dashboard, you must install the Dashboard to your farm using STSADM or PowerShell. Next, deploy the Dashboard to every Web application where you want to use the Dashboard. Finally, activate the Dashboard on all of the appropriate site collections.
Once deployed and activated, the Dashboard is available as an option on the Site Settings menu.