If you clear a warning alert and the condition becomes more serious, Metalogix Diagnostic Manager generates a critical alert. If you clear a warning alert or a critical alert and the condition becomes less serious then becomes more serious again, Metalogix Diagnostic Manager generates a new warning or critical alert.
To clear alerts in any view:
In any view where an alert appears, select the alert or group of alerts (using the [Ctrl] key to multi-select), right-click then choose Clear alerts.
|
|
NOTE: While the alert is cleared, the metric it represents is treated as if it was OK when Metalogix Diagnostic Manager rolls up the metric into the status of a component. That is, no component can have a warning or critical status as a result of a cleared alert. |
You can specify the conditions on monitored SharePoint farms, Server Groups, servers, and pages that trigger alerts. You can specify the type of alert generated and how Metalogix Diagnostic Manager responds to alerts. For certain alerts, you can choose to wait a specified period of time before Metalogix Diagnostic Manager raises the alert. Other alerts allow you to exclude certain server instances from the alert.
|
|
NOTE: When you specify the alert settings, you can create Warning Alerts and Critical Alerts. The trigger for the Critical Alert is always more serious than the trigger for the Warning alert. |
Note that for some alerts, a lower value is more serious than a higher value. These alerts include:
·Free Physical Memory (KB)
·Free Virtual Memory (KB)
·Disk Free Space (MB)
·Disk Free Percent (%)
Disk metrics include all mounted disks and mount points. For some metric types, you can exclude some data sources. For example, in some disk metrics, you can exclude volumes from the alerts. You can exclude items at the default level, or for individual objects in the farm.
Default Thresholds vs. Object-Specific Thresholds
Default alert thresholds are those that apply to all new farms, Server Groups, servers, and pages that are added to Metalogix Diagnostic Manager. Initially, these alert thresholds are specified for only the most common SharePoint needs. You can, however, change them to optimize Metalogix Diagnostic Manager for the needs of your environment.
You can also set alert thresholds that are specific to individual objects, such as farms, servers, and monitored pages.
|
|
NOTE: Currently you can only set SharePoint-specific alert thresholds at the individual farm level. The option is disabled for Server Groups. |
Excluding Server Instances from Alerts
Metalogix Diagnostic Manager allows you to exclude some server instances from alerting on some metrics. Currently, metrics that allow you to exclude are included in the Disk and SQL Server Database sections of the Alert Thresholds dialog box. The Do not raise alerts for the following disks and Do not raise alerts for the following databases options allow you to type the name of one or more disks or databases you do not want included in that alert.
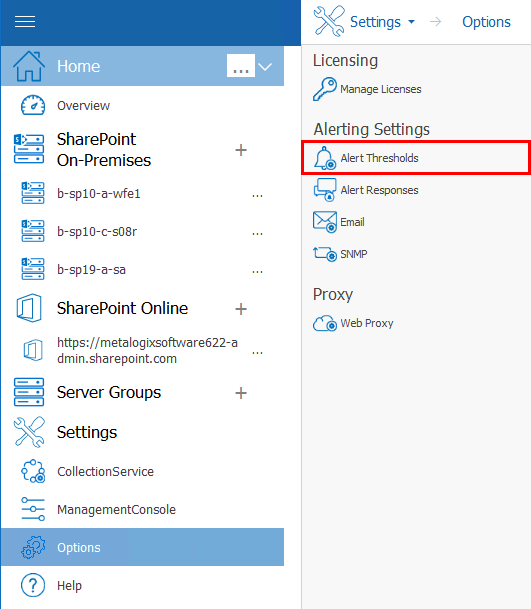
To access these options, click on Options under the Settings portion of the left hand panel, and select Alert Thresholds.
To specify the conditions that trigger alerts
1.Use the information in the following table to determine the appropriate action to take.
|
If you want to set ... |
Then ... |
|---|---|
|
default (global) alert thresholds |
In the Management Console ribbon, choose Options > Default Alert Thresholds. |
|
alert thresholds for a specific farm |
·From the Management Console tree, select the farm or the Content Summary node of the farm for which you want to set alert thresholds. ·Use one of the following options: §right-click then choose Edit alert thresholds for Farm. §in the Content Summary section of the ribbon, choose Content > Edit alert thresholds for farm. §in the Farm section of the ribbon, choose Alerting > Edit Alert Thresholds for farm. |
|
alert thresholds for a specific server |
·From the Management Console tree, select the server for which you want to set alert thresholds. ·Use one of the following options: §right-click then choose Edit alert thresholds for Server. §in the Server section of the ribbon, choose Alerting > Edit Alert Thresholds. |
|
alert thresholds for all monitored pages in a farm |
·From the Management Console tree, expand the applicable farm's Monitored Pages node. ·Use one of the following options: §right-click then choose Edit alert thresholds §in the Monitored Pages section of the ribbon, choose Edit Alert Thresholds. |
2.In the Alert Thresholds dialog box, select a metric that should trigger an alert. Make sure the box is checked, to enable editing.
Default Alert Thresholds dialog
Object-specific Alerts Thresholds dialog
3.Specify the conditions that trigger the alert.
|
|
NOTE: If you change the Alert priority, you can sort the Priority column in the Alerts view according to relative importance. |
4.If the alert lets you specify a waiting period, you can use the Raise alert after metric exceeds threshold field or the Raise alert after metric is in this state field to specify the number of minutes after the threshold has been exceeded before Metalogix Diagnostic Manager generates the alert.
5.If the alert lets you specify items to exclude, you can specify the objects to exclude in the Do not raise alerts field.
Use the format c: or c:\mount when specifying your disk or SQL Server database. Note that the instance name entered must match the instance name displayed in the alert. For example:
SQL Server: aadams\named
Database: master
Entry necessary to exclude: [aadams\named].master
6.Use the information in the following table to determine the appropriate action to take.
|
If you want to .... |
Then ... |
|---|---|
|
For Default (global) alert thresholds | |
|
reset all alert thresholds to their initial status |
click [Reset to default]. |
|
select additional objects to which you want to apply some or all of the threshold settings |
Click [Copy To]. a)In the Select Target Objects dialog, check the objects to which you want to apply the thresholds (or check Select All Objects). NOTE: By default, default values for All Thresholds will be applied to the selected object. You can however, choose to apply Only changed Thresholds. b)Click [Apply Changes]. |
|
For object-specific alert thresholds only | |
|
reset the object's thresholds to the global default thresholds |
click [Reset to default]. |
|
set the global default thresholds to the object's current thresholds |
click [Save as default]. |
7Click [Apply Changes] to save the changes and close the dialog box
You can configure how Metalogix Diagnostic Manager responds to alerts. For example, when an alert threshold is met you can have Metalogix Diagnostic Manager
·send an email
·write an event log entry, and/or
·generate an SNMP trap.
You can set up a unique response to every alert condition or use the same response to the same change in more than one metric. You can also specify the objects to which the response applies.
Alert Response Emails
As of version 4.14, if you configure an alert response to send an email, the email will be sent with an importance that corresponds to the priority of the alert. That is:
· if the priority of the alert is 1 or 2, the email sent is High importance
· if the priority of the alert is 3, the email is sent as normal
· if the priority of the alert is 4 or 5, the email sent is low importance
If an email is sent for multiple alerts with varying priorities, its importance will correspond to the alert(s) with the highest-priority. (The priority of each individual alert will be included in the body of the email.)
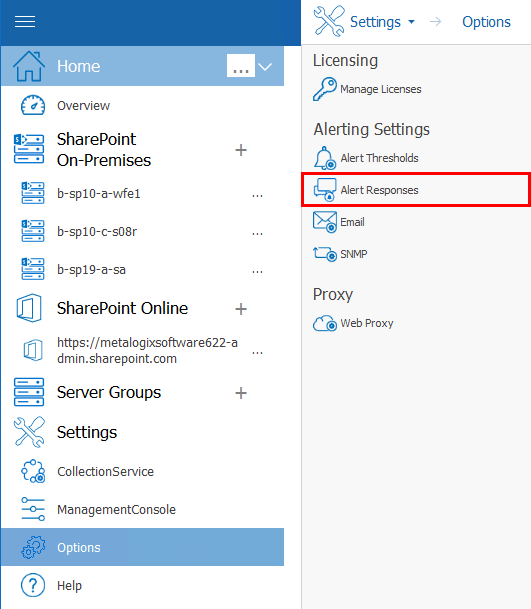
To access the Alert Responses dialog:
In the Management Console left hand panel, select Options, and choose Alert Responses.
Now you can:
·clone an existing alert response
·edit an existing alert response
·enable/disable an alert response
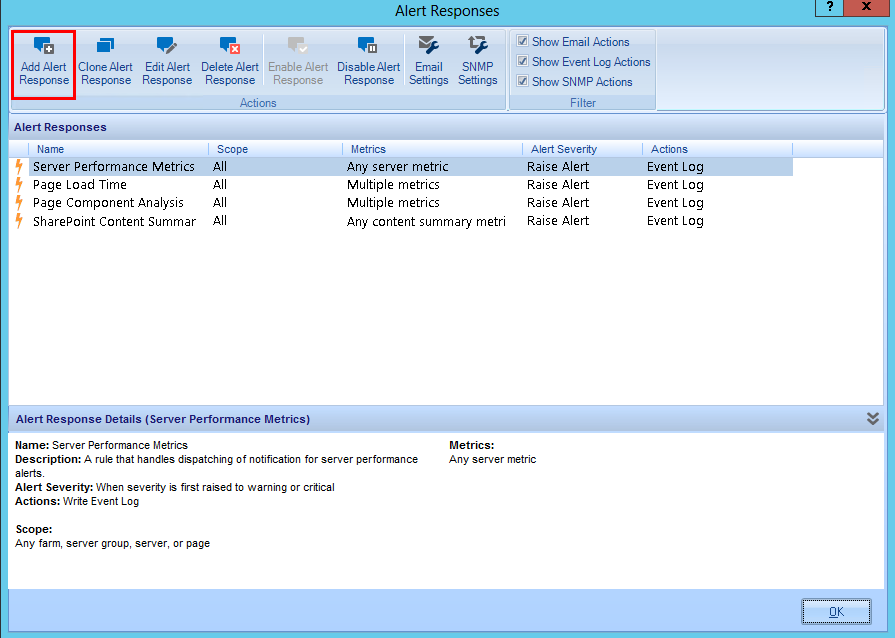
To add an alert response:
1In the Alert Responses dialog ribbon, choose Add Alert Response.
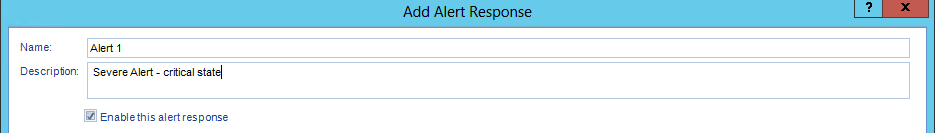
2In the Add Alert Response dialog box, specify a Name for the alert response. You can also enter a Description for the alert response. The description is for your benefit. Metalogix Diagnostic Manager does not use the description that you enter. If you leave the Enable this alert response check box selected, the alert response is enabled.
3From the Alert Severity drop-down, select the condition that triggers the response.
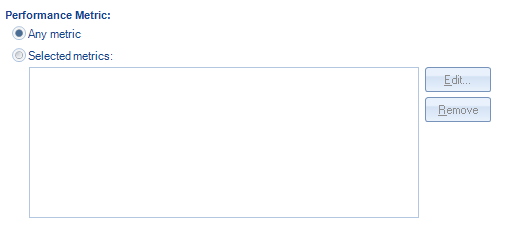
4For Performance Metric, you can click Any metric if you want any metric to trigger the response. You can click Selected metrics and then click [Edit] to choose one or more metrics if you want a subset of the metrics to trigger the response.
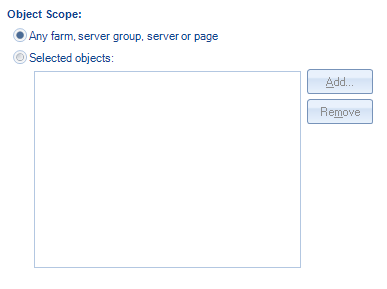
5For Object Scope, you can click Any farm, server, or page if you want any object to trigger the response. You can click Selected objects and then click [Edit] to choose one or more objects if you want a subset of the objects to trigger the response.
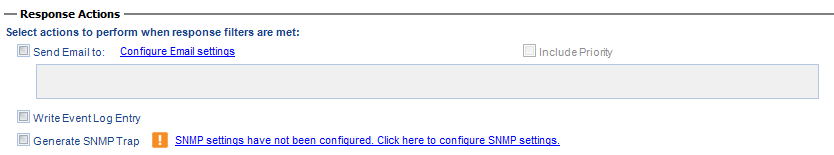
6For Response Actions, select what happens when an alert triggers the response. You can select one or more of the following:
§Send Email to, then specify one or more recipients (see also Configuring e-mail Setting)
|
|
CAUTION: Email settings are common across Metalogix Diagnostic Manager operations. For example, any changes made to email settings initiated from the Alert Responses dialog will also impact Scheduled Reports. |
§Write Event Log Entry
§Generate SNMP Trap (see also Configuring the SNMP Settings)
7Click [OK] to save the settings for the alert response.