
Foglight for Storage Management Environment Overview
This section provides an introduction to the Foglight for Storage Management, Environment Overview dashboard. When you log into Foglight for Storage Management for the first time, the Environment Overview dashboard > Overview tab is displayed.

The Overview tab shows the overall status of your virtual environment, and highlights various objects that need further exploration. You can select to view all or specific domains in your virtual environment, by clicking the All, VMware, Hyper-V, or OpenStack button, respectively, located on the top right corner of the tab. The Overview tab includes the following views:
|
• |
Overall Environment Summary. Provides a summary of your virtual environment. |
|
• |
Monitoring. Highlights the alarms that need immediate attention, for each monitored domain. Drill down into the available links, to review the alarms in more detail. |
|
• |
Virtual Machine Health. This functionality is currently unavailable. |
|
• |
Plan. This functionality is currently unavailable. |
|
• |
Tune. This functionality is currently unavailable. |
The Environment Overview dashboard also includes a Health tab, which allows you to review the health of your virtual environment. This tab includes the following views:
|
• |
VMware. Highlights the alarms that need immediate attention, in your VMware® environment. Drill down into the available links, to review the alarms in more detail. |
|
• |
Hyper-V. Highlights the alarms that need immediate attention, in your Hyper-V® environment. Drill down into the available links, to review the alarms in more detail. |
|
• |
Storage. Highlights the alarms that need immediate attention, in your Storage Management environment. Drill down into the available links, to review the alarms in more detail. |
|
• |
vCloud Director. Highlights the alarms that need immediate attention, in your vCloud environment. Drill down into the available links, to review the alarms in more detail. |
|
• |
OpenStack. Highlights the alarms that need immediate attention, in your OpenStack environment. Drill down into the available links, to review the alarms in more detail. |

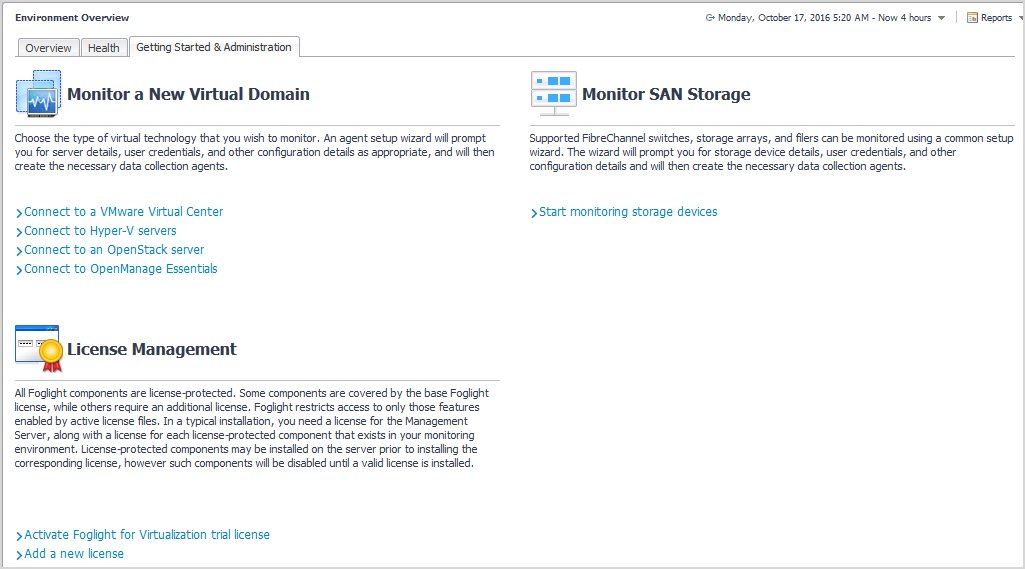
The Environment Overview dashboard also includes a Getting Started and Administration tab, which allows you to perform the following activities:
|
• |
Monitor a New Virtual Domain. Depending on the virtual technology that you want to monitor, select one of the following options: |
|
• |
Connect to a VMware Virtual Center. Launches a wizard to start the creation and configuration of a VMware Performance agent. |
|
• |
Connect to Hyper-V servers. Launches a wizard to start the creation and configuration of one Hyper-V agent or more Hyper-V agents of all servers (for target environment by batch). |
|
• |
Connect to an OpenStack server. Launches a wizard to start the creation and configuration of an OpenStack agent. |
|
• |
Connect to OpenManage Essentials. Launches a wizard to start the creation and configuration of an OpenManage Essentials (OME) agent. |
|
• |
Monitor SAN Storage. Allows you to monitor the SAN Storage, provided that the Storage Management license trial has been activated. |
|
• |
Start monitoring storage devices. Launches a wizard to start creating Storage Management agents. For more information, see the Foglight for Storage Management User and Reference Guide. |
|
• |
License Management. Allows you to manage the licenses for components installed with Foglight or Foglight for Storage Management, but not enabled. |
|
• |
Activate Foglight for Virtualization trial license. Activates the 45-day trial version of Foglight for Virtualization, Enterprise Edition. When the activation process completes, Foglight for Virtualization, Enterprise Edition (with Storage functionality) becomes the main entry point for monitoring your environment. For more information, see the Foglight User Guide and the Foglight Administration and Configuration Guide. |
|
• |
Add a new license. Allows you to quickly access the Manage Licenses dashboard. For more information on licenses, see the Foglight Administration and Configuration Guide. |
Foglight Operator's Welcome page
1. View, Acknowledge, and Clear Recent Alarms: Navigates to the Alarms dashboard. You can use this dashboard to view the state of all alarms across the entire Foglight installation so you can take immediate action on them. You can also use this dashboard to identify alarm storms or outage events by viewing the alarm count by time. See the User Guide for more information.
2. View Enterprise Health Organized by Monitoring Domain: Takes you to the Domains dashboard, from which you can view an end-to-end, top-level summary of all domains in the Domains dashboard and drill down to view their managed instances. See the User Guide for more information.
3. View the Health of Critical Services: Causes the Service Operations Console to appear. In the Service Operations Console, you can choose a group of services as a focal point for your monitoring. See Service Operations Console and the User Guide for more information.
4. View the Health of the Monitored Hosts in Your Enterprise: Takes you to the Hosts dashboard. Navigate to the Hosts dashboard if you want to view host-related alarms and a high-level summary of performance on your monitored hosts. See Hosts dashboard and the User Guide for more information.
5. Report on Your Enterprise: Causes the Reports dashboard to appear. Use this dashboard to view reports that are scheduled, run a report using a report template, create a custom report, schedule a report to run at a specific time, and manage reports. See the User Guide for more information.
6. Tap into the Foglight Community: Takes you to the Foglight Community (https://www.quest.com/community/products), where you can read blogs about Foglight and participate in discussions.
Foglight Administrator's Welcome page
This section provides an introduction to the Foglight Administrator’s version of the Welcome page. For details about this page, see the Administration and Configuration Guide.
1. View Your Enterprise Health: The View Your Enterprise Health page provides links to dashboards that allow you to observe the overall health of your system by viewing existing alarms and the state of your domains, services, and monitored hosts. See the Administration and Configuration Guide for more information.
2. Configure Alarm Reporting and Blackouts: Takes you to the Configure Alarm Reporting and Blackouts page, which contains additional links to the dashboards that show more details about the current email and blackout setup. Use these pages to configure Foglight to send alarm-related email using your email server and to suspend alarms and data collection. See the Administration and Configuration Guide for more information.
3. Report on Your Enterprise: Takes you to the Reports dashboard, from which you can view reports that are scheduled, run a report using a report template, create a custom report, schedule a report to run at a specific time, and manage reports. See the User Guide for more information.
4. Do More with Foglight: Opens the Do More With Foglight page. This page provides links to dashboards that provide more details about each aspect of your system health. Use these dashboards to define your own custom services, quickly build dashboards, view agent status, and perform other administrative functions. See the Administration and Configuration Guide for more information.
5. Tap Into the Foglight Community: Takes you to the Foglight Community (https://www.quest.com/community/products), where you can read blogs about Foglight and participate in discussions.
Service Operations Console
This section provides an introduction to the Services Operations Console dashboard. For details about this dashboard and services, see “Monitoring your services” in the Foglight User Guide.
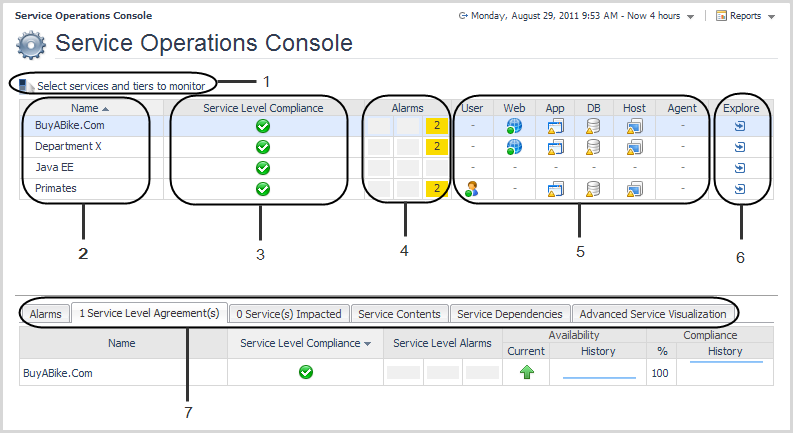
1. Select services and tiers to monitor link: Opens the Select services and tiers to monitor dialog box, which you use to select the services and tiers that interest you. Selecting services and tiers causes them to appear in the Service Operations Console dashboard. See the User Guide for details.
2. Name column: Lists the services that you select. See the User Guide for more information about services.
3. Service Level Compliance column: Shows the service level for each service. Foglight automatically creates a service level for each service. The level of compliance is determined by the component in the most severe state. See the User Guide for more information.
|
TIP: Click an icon in this column to display a popup with more information about the Service Level Agreement for the service. Follow the Explore > Service Level Agreement(s) link in the popup to navigate to the Service Levels dashboard populated with information specific to that service. See the online help for the Service Levels dashboard for details. |
4. Alarms column: Shows the number of alarms for the services that you select. Clicking one of the icons in this column causes an Outstanding Alarm(s) view to appear with a list of alarms specific to that service.
5. Tier columns: Show performance information for the tiers you chose to display. Tiers help you structure services in a way that represents your monitored environment. By default, Foglight organizes data into tiers such as User, Web, Application, Database, Host, and Agent. See the User Guide for more information. The icons in each column show the aggregate state of that tier for that category or service. A tier’s state is determined by the most severe state of its monitored components, including related hosts.
6. Explore column: Opens the Service Details view for the selected service. The Service Details view provides a breakdown of monitored components, related agents, and their associated outstanding alarms. See the User Guide for details.
7. Service Operations Console tabs: Display details for the selected category or service, such as its contents and dependencies. See the User Guide for details.