
Hosts dashboard
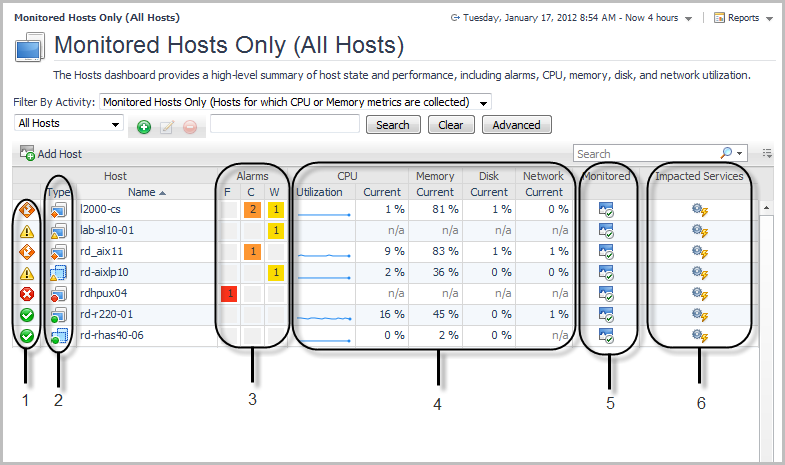
1. State indicators: Allow you to see the state of your hosts at a glance. Each state indicator shows the aggregate alarm state of the host, which is determined by the host’s most severe alarm. In this dashboard, the indicator represents a state rollup from the host and its children, excluding the state of agents on that host.
2. Type icons: Identify the host as physical or virtual: physical hosts are identified by the icon , VMWare images by the icon
, and ESX® servers by the icon
.
3. Alarms column: Shows the number of alarms for each host. To investigate alarms, click an icon in this column to display a view with a list of alarms for that host. See “Viewing, acknowledging, and clearing alarms” in the User Guide for information about working with alarms.
4. CPU, Memory, Disk, and Network columns: Each column displays recent and current values for that metric category, allowing you to obtain a concise overview of CPU-, memory-, disk-, and network-related performance for each host. The values displayed in the sparkline change with the dashboard’s time range. By default, a sparkline is shown only in the CPU Utilization column. See “Viewing a host’s performance” in the User Guide for more information.
5. Monitored column: Identifies whether or not the host is configured for monitoring. If the host is not monitored, click the icon to launch a popup that lets you configure monitoring. If the host is monitored, clicking the icon opens the Agent List popup.
6. Impacted Services icons: Launch a popup that helps you establish whether critical services are affected by problems with one of your hosts. See “Seeing if a host’s state impacts your services” in the User Guide for details.
Next steps
|
• |
If you read this guide prior to installing Foglight: Select the appropriate platform- and database-specific Installation and Setup Guide and follow the instructions for installing and configuring Foglight. |
|
• |
If you are an operator responsible for monitoring a large environment: Follow a service- or host-oriented workflow. For example, if you are responsible for ensuring the availability of your accounting application service, you can follow a service-oriented workflow that begins in the Service Operations Console. If you prefer a less abstract approach, you can follow a host-oriented workflow that begins in the Hosts dashboard. You can correlate these two approaches: the Service Operations Console displays the aggregate state of the hosts in a service and the Hosts dashboard allows you to view the services on which a host’s state has an impact. See the User Guide for details. |
|
• |
If you are a technical expert interested in monitoring a specific domain: Start with the documentation included with the Foglight cartridge for monitoring that domain. |
|
• |
If you are interested in monitoring services: You can follow a service-oriented workflow. See the User Guide for details about the drilldowns available from the Service Operations Console. |
|
• |
If you want to customize aspects of the Foglight browser interface: Begin by following the instructions in “Customizing Foglight” in the User Help. |
|
• |
If you are a Foglight administrator: See the Administration and Configuration Guide and the Command-Line Reference Guide for information about performing administrative tasks (in addition to those described above) from the Foglight browser interface and from the command line. |
|
• |
If you want to create custom dashboards: Review the information in “Creating a Custom Dashboard” in the Foglight User Help. You could then learn more about creating dashboards by following “Tutorial 2: Creating a Dashboard” in the Web Component Tutorial. |
|
• |
If you want to create custom views: Begin by following “Tutorial 4: Adding Views” in the Web Component Tutorial. After this tutorial, see the Web Component Guide and the HTML Web Component Reference pages. These resources can help you create new views using the Quest Web Component Framework technology. |