Chat now with support
Chat with Support

Foglight 5.9.1 - Performance Tuning Field Guide

Overview Hardware and Operating System Tuning Management Server Tuning Java Virtual Machine Tuning Backend Database Tuning High Availability (HA) Tuning Agent Tuning Appendix: Performance Health Check Appendix: Analyzing a Support Bundle

Analyzing a Performance Report

The Support Bundle contains a Management Server Performance Report (PerfReport.pdf), which can be helpful in diagnosing issues related to server performance.

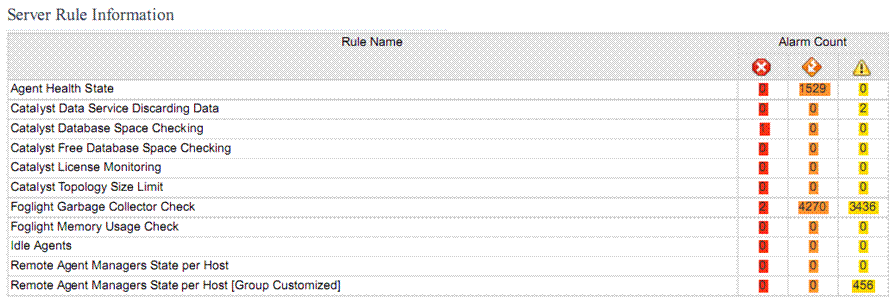
Server Rule Information

Check the following:

System-wide Topology Changes

Topology changes should be considered over a 7-day span.

Some cartridges generate new topology objects regularly and this is considered normal behavior. Such cartridges can produce hundreds of changes over a 7-day span.

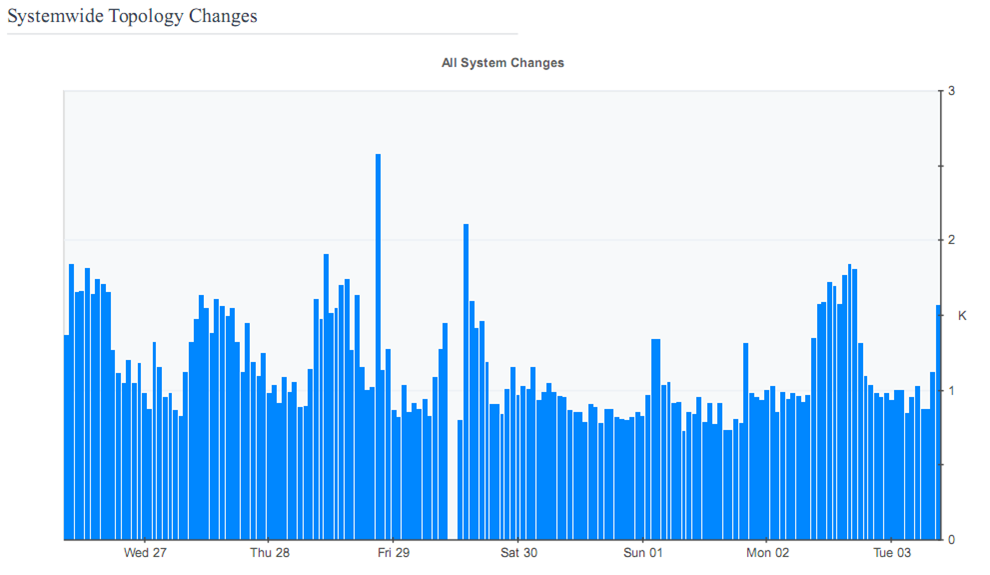
If thousands of changes are generated, however, there may be an issue. In such cases, review the diagnostic snapshot to determine if there are Topology Related Issues.
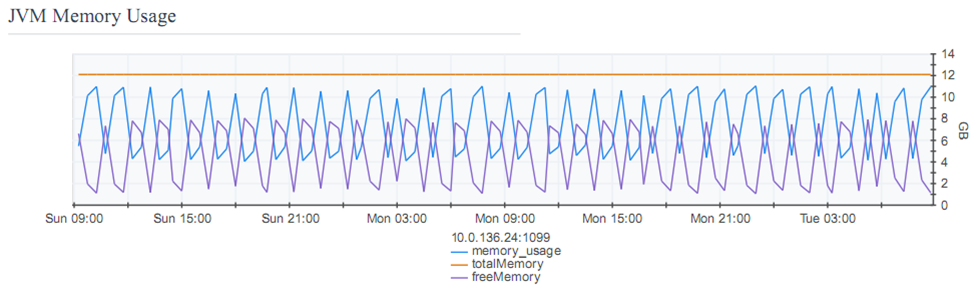
JVM Memory Usage

The Support Bundle contains a Foglight™ Management Server Performance Report (PerfReport.pdf). In the Performance Report, under the “Management Server Java Virtual Machine Memory” heading, there are a number of JVM memory charts.

In the JVM memory charts, the JVM heap is divided into New Generation, Old Generation, and Permanent Generation. The New Generation JVM heap is further divided into Eden and Survivor spaces. The charts display the memory utilization for each of these. The charts can help you determine whether or not the entire heap (Xms and Xmx), or just one generation (NewSize and MaxNewSize), is insufficient.

Typically, when objects are first created, they reside in the Eden space. Once objects survive a garbage collection (GC), they are moved into the Survivor space. If the garbage collector determines that the objects in the Survivor space are no longer live objects, then they are moved into the Old Generation. This helps the JVM efficiently manage its memory, because short-lived objects can easily be collected from the Eden space without the need for the garbage collector to scan the entire heap.

Typically, a sawtooth (up, down, up, down) pattern is a normal memory usage pattern for the Management Server. The server generates some garbage in the Old Generation, which is fine. Then, at some point, the JVM recycles the garbage.

A sudden drop in the Old Generation memory usage does not always indicate that a full GC has occurred, because the server now uses the parallel GC which runs in the background. Full GCs (during which the server slows down due to the garbage collection) are usually visible in the GC chart for ConcurrentMarkSweep, which is included in PerfReport.pdf. If the time or count lines rise above zero for a prolonged period, that indicates that the server is probably running out of memory. The GC becomes intense only when the sawtooth pattern hits 100%.

Permanent Generation is used for items like classes that are typically never collected.

If the Min/Max/Used line on the CMS Old Gen chart repeatedly hits the horizontal purple (Committed) line, further diagnosis (for example, matching with other performance metrics at the time) is required. That pattern typically indicates that the JVM was working extra hard to reclaim memory. Check for this situation by opening the Diagnostic Snapshot and searching for “Cache Policies”. This shows the entries that are in the cache and therefore consuming memory. If there is no list of entries, then there were no entries when the snapshot was taken.

To find the actual retention policy, open the Monitoring Policies XML file and search for lifecycle definitions.

Good:

A consistent and regular pattern of memory being used and freed. Garbage collections are performing correctly.

Bad:

A gradual exhaustion of the heap is indicated by slow and steady decline in the free memory, leading to a flat line. Here, no memory is being freed by GC.

Good, becoming Bad:

Part of the graph indicates a constant, regular pattern of memory being freed. The warning sign is that less memory is being freed each time in the later cycles.

Related Documents

The document was helpful.

Select Rating

I easily found the information I needed.

Select Rating