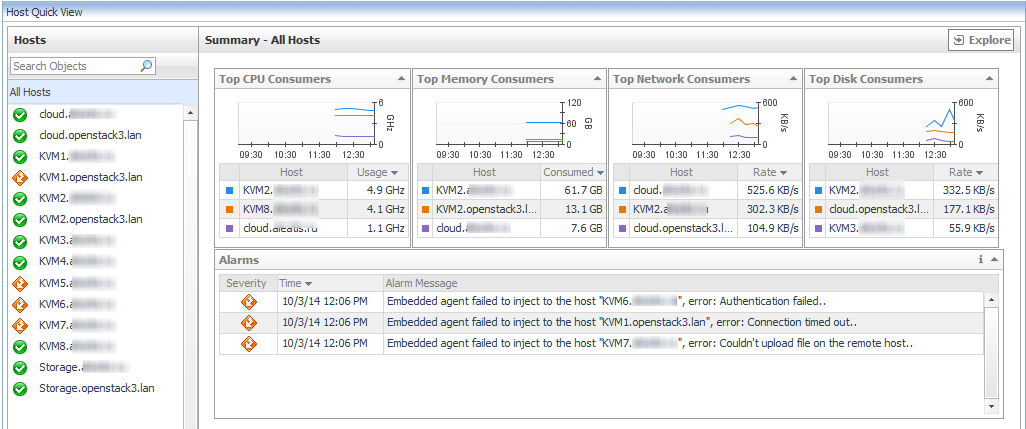
The Quick View appears in the middle of the Monitoring tab on the OpenStack Environment dashboard. For more information about this dashboard, see Using the OpenStack Environment dashboard .
The Quick View is made up of the following embedded views:
|
• |
Resource object list view: displays the list of objects associated with the selected resource. |
|
• |
FAQts view: displays the list of questions relevant to the selected resource. |
|
• |
Summary view: displays a summary of relevant information related to the selected resource object or group of objects. |
|
• |
Alarms view: displays a list of alarms and when they were raised. |
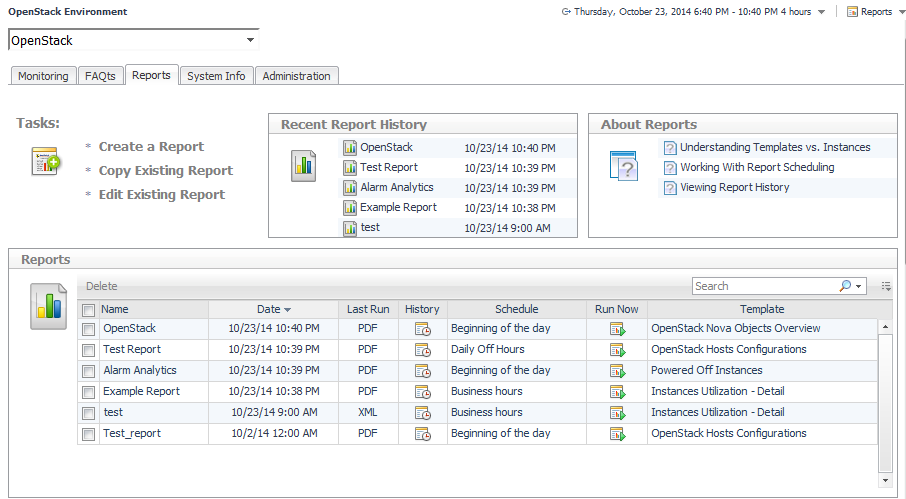
Predefined report templates are included with Foglight for OpenStack.
For more information about the Reports dashboard, see the Foglight User Help.
The following templates are available with Foglight for OpenStack.
|
Lists the powered off virtual instances in the specified service. | |
|
Contains the alarm (or event) history for the selected Service. | |
|
Contains the alarm (or event) history for the selected Service. |
The Resource Utilizations view, typically located across the center of the Quick View display area, provides numerical and graphical representations of performance data associated with a chosen resource objects. To find it, open the OpenStack Explorer and on the Topology tab select the name of a particular resource from the resource object list in the left frame.
For example, selecting a particular Host Aggregate from the Topology tab and opening the Performance tab in the display area, displays four graphs in the Resource Utilizations view. The graphs depict CPU, memory, disk, and network resource utilizations for the selected Host Aggregate.
On the Summary tab, clicking a graph or a spinner shows a larger view of the graph with descriptive text about each metric appearing in the graph.
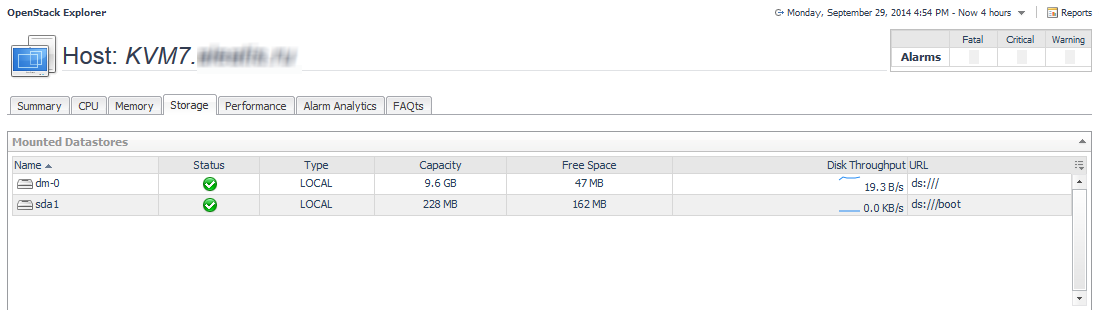
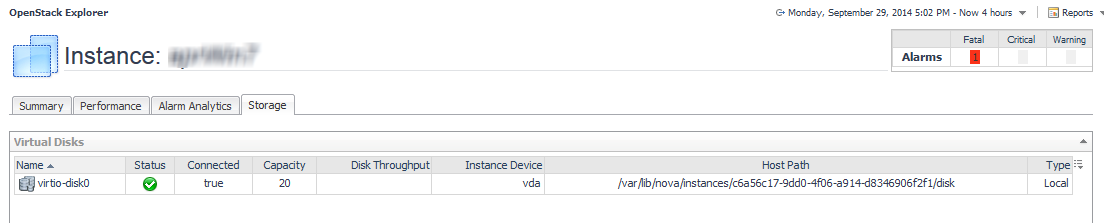
This tab is available in the OpenStack Explorer. To find it, open the OpenStack Explorer and on the Topology tab, that appears on the navigation panel, select a host or an Instance.
The tables displayed vary according to whether you selected a host or an instance.
The Storage tab displays a list of all mounted datastores on a Host or a list of all virtual disks associated with a particular Instance.