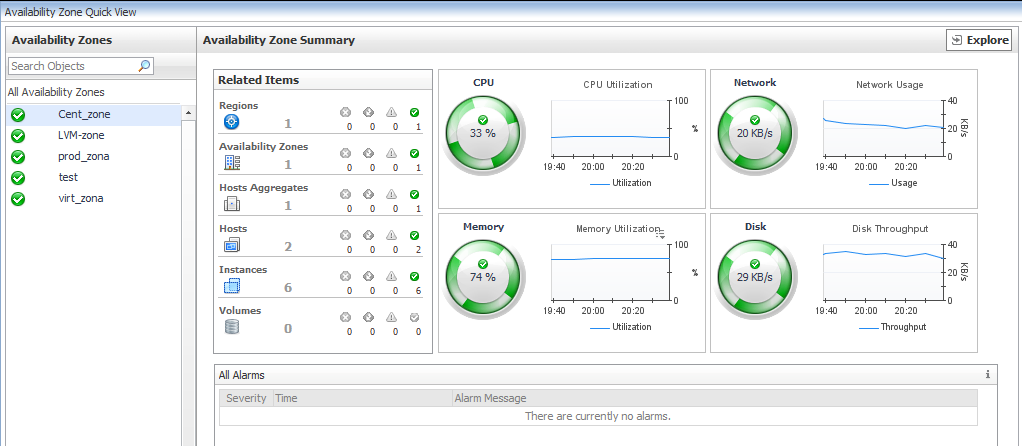
When you click the Availability Zones tile, a list of configured Availability Zones is displayed in the left frame. The default selection is All Availability Zones with the Summary — All Availability Zones frame displaying: Top CPU Consumers, Top Memory Consumers, Top Network Consumers, and Top Disk Consumers.
Click the Explore link on the upper right of the Quick View to view detailed information about the selected Availability Zone.
Clicking an object type in the Related Items view displays a list of related objects of that type along with their statuses.
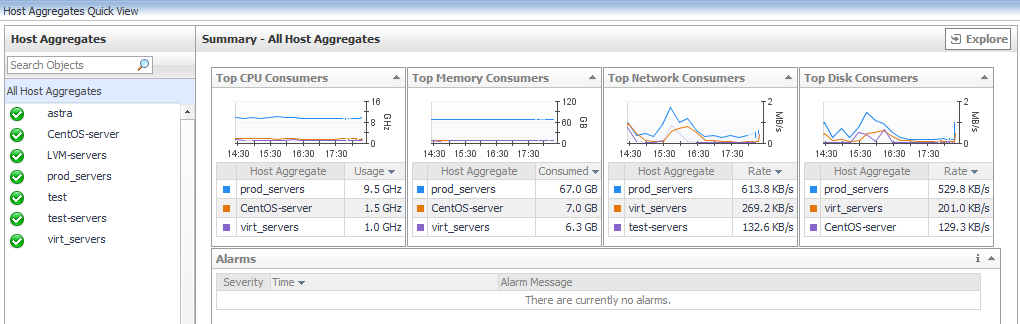
When you click the Host Aggregates tile, a list of configured Host Aggregates is displayed, with the default selection being All Host Aggregates. The Summary — All Host Aggregates frame shows the trends for each Host Aggregate.
Click the Explore link in the upper right of the Quick View to view detailed information about the selected Host Aggregate.
Clicking an object type in the Related Items view displays a list of related objects of that type along with their statuses.
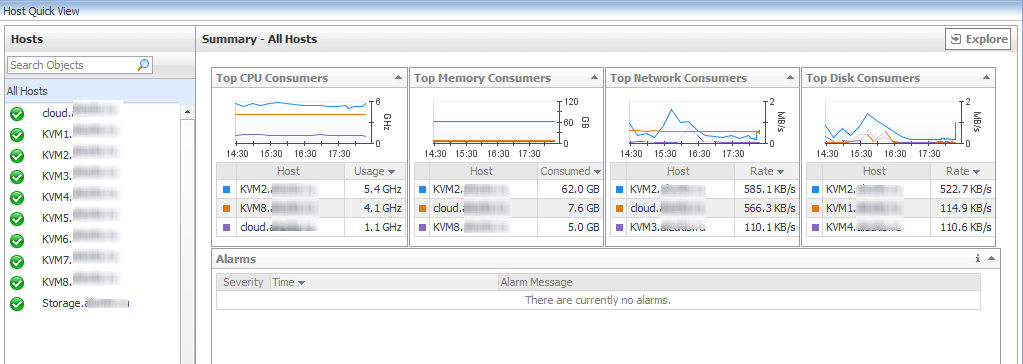
When you click the Hosts tab, a list of all configured hosts is displayed with their status. The default selection being All Hosts. The Summary — All Hosts frame displays a list of relevant alarms and a summary of the top CPU consumers, top memory consumers, top network consumers, and top disk consumers.
Click the Explore link in the upper right of the Quick View to view detailed information about the selected Host.
Clicking an object type in the Related Items view displays a list of related objects of that type along with their statuses.
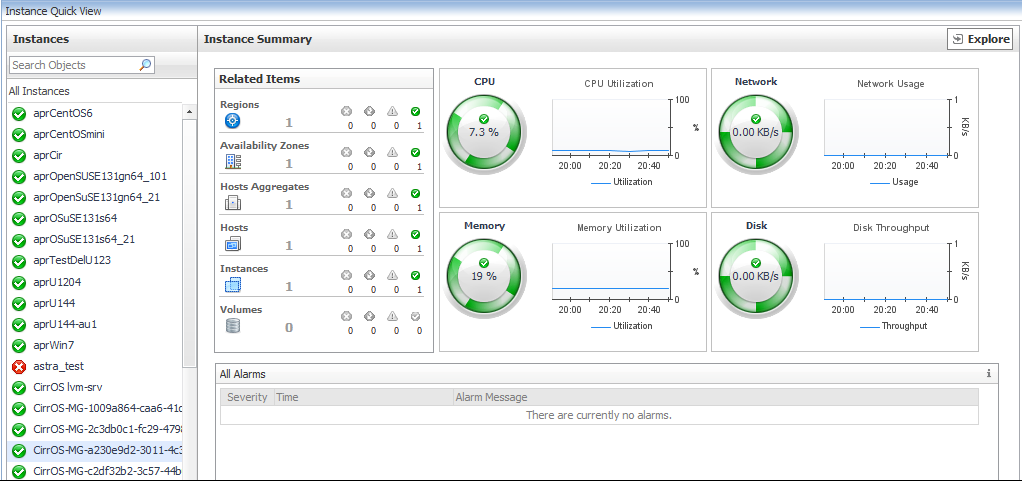
When you click the Instances tab, a list of all Instances is displayed, with the default selection being All Instances. The Summary — All Instances frame displays a list of relevant alarms and a summary of the top CPU consumers, top memory consumers, top network consumers, and top disk consumers.
Click the Explore in the upper right of the Quick View to view detailed information about the selected Instance.
Clicking an object type in the Related Items view displays a list of related objects of that type along with their statuses.