|
NOTE: For hosts, always select the host object, regardless of whether or not the host is virtual (for example, Hyper-V® or VMware®). Foglight looks for the appropriate host extensions and displays the associated host dashboard (physical or virtual). |
Click the title bar to drill down to the Virtual Machine detail view.
| |||
| |||
| |||
| |||
| |||
| |||
| |||
|
Detail views are drill down views accessible from some tile views.
For more information about a specific view, see:
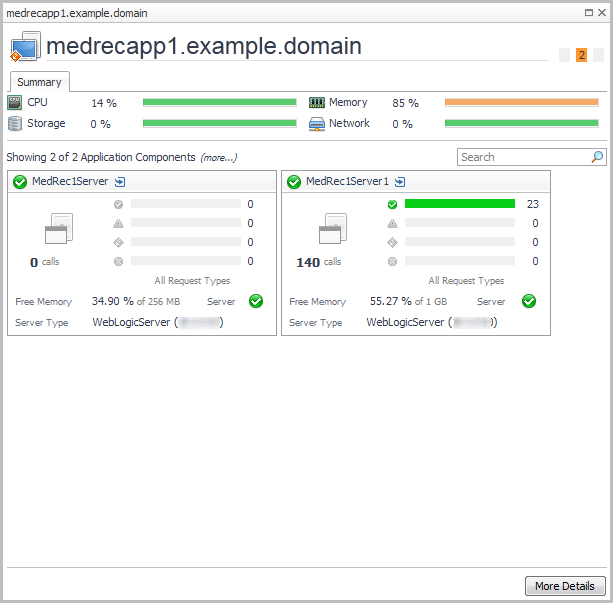
The Request Types tab lists the following information for each request type: request name, response time, bottleneck location (based on the most time-consuming tier of a request), calls completed, calls incomplete, call exceptions, and number of traces.
The chart shows the tier breakdown for the selected request.
The information presented on the Server Info tab depends on the type of application server selected: JBoss®, OracleAS, Apache Tomcat, WebSphere®, or WebLogic®.
|
• |
The banner shows host metrics if the host is monitored. Click More Details to see the performance details for the host.
If the host is not monitored, then:
|
• |
If the host is not part of a Federated environment, and the Foglight Cartridge for Infrastructure is installed, click Add OS Monitor to configure host monitoring. For information, see the Foglight for Infrastructure User and Reference Guide. |