Configure Directory Services
If you are using Active Directory, and have trusts configured to allow users from one domain to access resources in different domain, keep in mind that these trusts require OS authentication and as such cannot be used in Foglight. When LDAP is configured, Foglight authenticates users through the main Active Directory forest, but it only searches the domains that are the children of the primary LDAP server (specified by the Nearest LDAP server URL setting). If the primary LDAP server fails, it searches the domains that are the children of the secondary LDAP server (specified by the Secondary LDAP server URL setting). For more information about problems that you may encounter when configuring LDAP with Active Directory, see Common Active Directory configuration problems.
|
• |
Nearest LDAP server URL: The URL to the primary LDAP server. |
|
• |
host is the fully qualified domain name or IP address of the LDAP server. |
|
• |
port is the port number of the LDAP server. |
|
• |
Secondary LDAP server URL: The URL to the secondary LDAP server. |
|
• |
Account is anonymous: If set to true, Foglight uses an anonymous service account to search for users in the extended directory. The default user name for anonymous service accounts is __anonymous__. Enabling this option sets the Distinguished name of the service account to __anonymous__. |
|
• |
Distinguished name of the service account: The distinguished name (DN) of the service account for further user searching, or a special account, such as __anonymous__. In Active Directory, typically, a common name (CN) is used instead of DN. |
|
• |
Group attribute for nested group searching: Specifies the name of the attribute of groups (for example, member) that contains nested groups’ distinguished names. It is used for resolving nested group membership in indirect Mode of group searching. |
|
• |
JAAS LoginModule Name: This setting is internal and as such should never be modified. |
|
• |
Match on User DN: Indicates if user distinguished names are matched. |
|
• |
Maximum level of group nesting: Specifies the maximum number of nested groups that can be queried. |
|
• |
Parent group attribute ID: Specifies the name of the attribute of users and groups (for example, memberOf) that holds the containing groups’ distinguished names. Used for resolving group membership of users and recursive groups in direct Mode of group searching. |
|
• |
Password: The password of the service account used for user searching in the external directory. |
|
• |
LDAP query prefix, LDAP query suffix: An LDAP query searches for user accounts in the external directory. It takes the user information provided on the Foglight login page (see Logging in to the Foglight browser interface) and searches for user information in the external directory. The directory tree typically contains multiple levels. Searching individual parts of the directory tree makes the authentication process shorter and more efficient as opposed to searching the entire directory tree which can result in request time-outs. You can narrow down to the specific groups that you want the LDAP queries to use by setting the prefix and suffix of the query. |
|
• |
LDAP query prefix: CN= |
|
• |
LDAP query suffix: ,CN=Users,DC=2k3,DC=dom |
|
• |
Role attribute ID, Is Role attribute a DN: Groups in the external directory are objects with attributes. Each attribute has an ID and a value. The setting Role attribute ID specifies the name of the attribute that uniquely identifies the name of the role in the external directory. LDAP queries use the role attributes to authenticate users. Is Role attribute a DN specifies if the role attribute is a distinguished name. |
|
• |
Mode of group searching: Indicates the direction in which groups are searched: |
|
• |
disabled: Do not search for groups. |
|
• |
|
• |
indirect: Search for groups in the scope to using the User attribute ID to search for groups and Group attribute for nested group searching. |
|
• |
The scope(s) to search for groups, The second group namespace, and The third group namespace: These settings indicate the groups in the external directory tree that are queried for a specific user whose authentication information is provided on the Foglight login page. You can specify up to three groups in the external directory, as required. The order in which the groups are searched is determined by the order these settings are listed: first, the query searches the group specified by the The scope(s) to search for groups setting, then the group specified by The second group namespace, and finally, the group specified by The third group namespace. |
|
• |
Environments with up to three or four users: There is no need to assign these groups. Instead, have the Foglight administrator assign the required roles after the initial user logins. |
|
• |
Larger environments: In Active Directory, create the same set of groups that exist in Foglight: Foglight Administrators, Foglight Security Administrators, and Foglight Operators. Add Active Directory user accounts that you want to integrate with Foglight to these groups, and set the The scope(s) to search for groups to point to the OU contaning these groups. |
|
• |
LDAP search timeout (milliseconds): Specifies the maximal duration of an LDAP search, in milliseconds. LDAP searches that take longer than that result in time-outs. |
|
• |
Name of JAAS security domain: This setting is internal and as such should never be modified. |
|
• |
User alias attribute ID: User accounts in an external directory can have aliases. This setting specifies the name of the attribute associated with the user alias. |
|
• |
User attribute ID to search for groups: Specifies the name of the attribute of groups (for example, member) that contains users’ distinguished names. It is used for resolving group membership through groups in indirect Mode of group searching. |
|
• |
The LDAP context for user searching: Similar to specifying the groups in the directory tree, this setting provides a way for selecting a portion of the directory tree, giving a context to the query. |
|
• |
LDAP query suffix: ,CN=Users,DC=2k3,DC=dom |
|
• |
The LDAP context for user searching: CN=Users,DC=2k3,DC=dom |
|
com.quest.nitro.service.security.auth.spi.NitroExtendedLdapLoginModule | |||
|
OU=Foglight Admins,DC=emea, DC=corp,DC=apax,DC=com Note: Setting the scope to search for a group with the ldap root DN may cause a javax.naming.PartialResultException during searching. To search from the root DN, change the ldap url to use a global category. For example, setting the Nearest LDAP server as ldap://ukdatemea01:3268 should prevent a javax.naming.PartialResultException. |
|||
You can use the Active Directory dsquery command to see the DN for a Service Account.
This command creates a text file that you can search for proper Service Account DNs.
Foglight uses the LDAP context for user searching setting to determine where to start looking for LDAP users in the LDAP directory when an LDAP user logs into Foglight. Foglight searches for that user in that location, and every container level under that starting point. If the user account is at a higher level than what is set by the LDAP context for user searching, the login fails.
To test this behavior, simply set the context to the highest level of the LDAP tree. In Microsoft Active Directory, this is the Domain. For example, if the AD domain is example.com, the .LDAP context for user searching can be set to DC=example,DC=com.
You can adjust this setting later after ensuring that Foglight integration with LDAP works.
If LDAP authentication is not working in Foglight, try configuring the LDAP query prefix setting to force using older NTLM authentication. Do this by changing the LDAP query prefix from “CN=” to “sAMAccount=” .
|
• |
Missing the leading comma in the LDAP query suffix setting. The valid format looks like this: |
|
• |
Changes to the JAAS LoginModule Name setting. The valid format looks like this: |
Observing the result of a login attempt can often tell you if LDAP is successfully configured.
This message confirms that the LDAP configuration is successful. You just need to log in as a Foglight Security Administrator and add the newly added LDAP (External) user to a Foglight group which has the appropriate abilities (roles) granted.
If LDAP is not configured correctly, you see the following message:
|
1 |
|
2 |
On the Users and Security Management dashboard that appears in the display area, click Directory Services Settings. |
|
3 |
From the Configuration for drop-down list, select an LDAP configuration to be used for leverage. |
|
4 |
|
5 |
|
1 |
|
2 |
On the Users and Security Management dashboard that appears in the display area, click Directory Services Settings. |
|
3 |
From the Configuration for drop-down list, select an LDAP configuration that you want to use for the user authentication. |
|
4 |
Click Activate. |
Once an LDAP configuration is activated, the Activate button will be changed to Deactivate. You can repeat the above workflow to deactivate this LDAP configuration when needed.
|
1 |
|
2 |
On the Users and Security Management dashboard that appears in the display area, click Directory Services Settings. |
|
3 |
From the Configuration for drop-down list, select an LDAP configuration that you want to delete. |
|
4 |
Click Delete. |
|
5 |
Click OK. |
|
1 |
|
2 |
On the Users and Security Management dashboard that appears in the display area, click Directory Services Settings. |
|
3 |
|
4 |
|
5 |
Click Save. |
|
2 |
|
3 |
On the Users and Security Management dashboard that appears in the display area, click Directory Services Settings. |
|
1 |
|
2 |
|
5 |
Editing one setting at a time. On the Configure Directory Services view, click the Value column of the setting you want to edit. |
|
a |
|
b |
|
a |
|
b |
In the Test Configuration dialog box, type the name of a user account that exists in the newly integrated external directory, and click Test. |
|
1 |
|
2 |
On the Users and Security Management dashboard that appears in the display area, click User Session Settings. |
|
• |
To define a specific user session timeout, in the Number of minutes after which user should be logged out box, type the number of minutes. |
|
• |
To set the user session timeout to an infinite period, select the Session Never Times Out check box. |
|
4 |
Where **Some other Role** is a role that you have created and assigned to users or groups that you want to be able to perform global search.
Blackout Configuration
|
• |
Manage Blackouts. Use this dashboard to view, create, and delete blackouts. For more information, see Explore and manage blackouts. |
|
• |
View Blackouts by Object. Use this dashboard to view topology blackouts. Topology blackouts do not interrupt the data collection for the object to which the blackout is assigned. For more information, see View a list of blacked out objects. |
|
• |
View Blackouts by Agent. Agent blackouts are events during which the agent ceases to collect data for the duration of the blackout period. For more information, see View a list of blacked out agents. |
By default, the following columns are displayed:
|
• |
Name contains the blackout name. |

|
• |
Schedule, Name contains the name of the schedule associated with the blackout. |
|
• |
|
• |
Schedule, State indicates if the blackout schedule is in effect (Current), expired (Expired), or set to occur at a later time (Future). |
|
• |
Includes Children indicates whether the blackout is inherited by the descendents of the affected type (topology blackouts only): Yes or No. |
|
• |
In addition to these columns, the following columns can also be displayed by clicking and selecting them from the Show Columns dwell that appears.
|
• |
Next Start shows the date and time on which the next instance of the blackout period starts. |
|
• |
Next End shows the date and time on which the next instance of the blackout period ends. |
|
• |
Duration shows the length of time during which the next blackout period will be in effect. |
Click Create One-Time Blackout or Create Scheduled Blackout to start the Create Blackout Wizard that allows you to quickly add a new blackout to the existing collection. For more information about the available flows, see Create one-time agent blackouts, Create scheduled blackouts for alarms, and Create scheduled blackouts for agents by selecting objects.
The left-most column in the list contains check boxes that allow you to select one or more blackouts, and delete them, as required. Click Select All and Select None to select all variables or clear all selections, respectively.
To access this dashboard, on the Blackouts page, click View Blackouts by Object. For each topology object, the following columns are displayed.
|
• |
Name contains the name of blacked out topology object. |
|
• |
Type contains the name of the topology type of the blacked out object. |
|
• |
Includes Children indicates whether the blackout is inherited by the descendents of the affected type (topology blackouts only): Yes or No. |
|
• |
Monitored Host contains the name of the host associated with the blacked out object. |
|
• |
Schedule contains the name of the schedule associated with the blackout. |
|
• |
|
• |
Schedule State shows if the blackout schedule is in effect (Current), expired (Expired), or set to occur at a later time (Future). |
To access this dashboard, on the Blackouts page, click View Blackouts by Agent. For each topology object, the following columns are displayed.
|
• |
Name contains the name of blacked out agent instance. |
|
• |
Type contains the type of the blacked out agent instance. |
|
• |
Host contains the name of the host the blacked out agent is monitoring. |
|
• |
Schedule contains the name of the schedule associated with the blackout. |
|
• |
|
• |
Schedule State shows if the blackout schedule is in effect (Current), expired (Expired), or set to occur at a later time (Future). |
There are two types of blackouts that can be assigned to agent or topology object instances:
To create one-time blackouts, click Create a One-Time Blackout on the Blackouts page. To create scheduled blackouts, click Create a Scheduled Blackout.
The resulting workflow is in wizard form. You can navigate between the steps in the wizard using the navigation buttons that appear in the bottom-right corner of the display area (Previous, Next, Finish, and Cancel), or use the bread crumb trail to return to the Blackouts page.
For more information about the workflows in the Create Blackout Wizard, see the following topics:
|
1 |
|
2 |
On the Blackouts page, click Create a One-Time Blackout. |
|
3 |
|
4 |
Indicate that you want to choose agents by selecting specific agent instances. Ensure that Select the Agents Directly from a List is selected, then click Next. |
|
• |
Blackout Name: One-time blackout for infrastructure agents |
|
• |
Reason for Blackout: Daily maintenance |
|
9 |
Click Go to Manage Blackouts Page. |
|
1 |
|
2 |
Indicate that you want to create a scheduled blackout. On the Blackouts page, click Create a Scheduled Blackout. |
|
3 |
Indicate that you want to black out alarms. Ensure that Suspend Alarms is selected, then click Next. |
|
• |
Use an advanced search to look for specific objects by selecting Advanced Search (All Types). |
|
• |
Blackout Name: Scheduled blackout for my Windows host |
|
• |
Reason for Blackout: Daily maintenance |
|
8 |
Click Go to Manage Blackouts Page. |
|
1 |
|
• |
Use an advanced search to look for specific objects by selecting Advanced Search (All Types). |
|
9 |
Optional — Specify a different name or a reason for the blackout. |
|
• |
Blackout Name: Scheduled blackout for my Windows agents |
|
• |
Reason for Blackout: Daily maintenance |
|
10 |
Click Go to Manage Blackouts Page. |
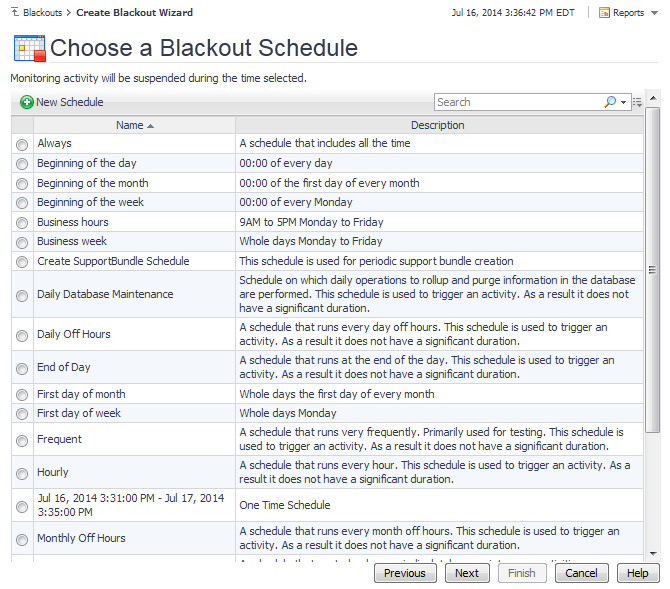
Another way to create a new schedule is using the Create Schedule dashboard. For more information about this workflow, see Create schedules.
|
1 |
From the workflow for creating or editing blackouts or reports, click Create New Schedule. |
|
2 |
In the Simple New Schedule Wizard dialog box, in the Select a schedule pattern type area, select one of the available schedule patterns. |
|
1 |
|
2 |
On the Blackouts page, click Manage Blackouts. |
|
4 |
Click the Name column. |
|
5 |
|
a |
To change the blackout name, in the Name box, type the new name. |
|
b |
To change the reason for the blackout, in the Reason box, type the new reason. |
|
c |
Click Apply. |
|
6 |
To associate the agent blackout with a different schedule, in the Schedule Information area, click Change. |
|
b |
To create a new schedule, click Create New Schedule and follow the flow in the Simple New Schedule Wizard. When done, select the newly-created schedule. For more information, see Create a new schedule. |
|
c |
|
7 |
|
8 |
|
1 |
|
2 |
On the Blackouts page, click Manage Blackouts. |
|
4 |
Click the Name column. |
|
5 |
|
a |
To change the blackout name, in the Name box, type the new name. |
|
b |
To change the reason for the blackout, in the Reason box, type the new reason. |
|
c |
Click Apply. |
|
6 |
To associate the topology blackout with a different schedule, in the Schedule Information area, click Change. |
|
b |
To create a new schedule, click Create New Schedule and follow the flow in the Simple New Schedule Wizard. When done, select the newly-created schedule. For more information, see Create a new schedule. |
|
c |
|
7 |
To remove topology objects from the blackout, in the Blacked Out Topology Objects area, click Remove Items. |
|
8 |
Some Foglight dashboards have reports associated with them. This allows you to run a report based on the current dashboard. You can generate the report using the Reports menu in the top-right corner.
The Blackouts dashboard is associated with the Blackouts Report. Run this report by choosing Blackout Report from the Reports menu, and specifying the input parameters in the report wizard.
The report wizard provides more information about the Blackouts Report. For more information about reports in Foglight, see the Foglight User Help.
Manage Support Bundles
The Manage Support Bundles dashboard allows you to create server support bundles, and to retrieve server and Foglight Agent Manager support bundles. To create Agent Manager support bundles, use the Agent Manager Support Bundle dashboard. For more information about this dashboard, see Create and download Agent Manager support bundles.
When you create a host support bundle, Foglight generates a ZIP file in the <foglight_home>/support/<user_name> directory on the machine hosting the Management Server. The support bundle file name uses the following syntax:
|
1 |
|
2 |
Click Create Management Server Support Bundle. |
|
4 |
|
1 |
|
2 |
On the Support dashboard, in the Support Bundle Inventory view, locate the support bundle that you want to retrieve. |
|
3 |
In the row containing the support bundle, click the Name column. A dialog box opens. |
For information on how to create or edit registry variables, see View and edit registry variable settings .
|
1 |
|
4 |
Click Upload to Support. |
|
5 |
Click Upload. |
|
6 |
On the Upload Bundle progress dialog, click Close to close the dialog. The upload will continue. Click Cancel to cancel the upload. |
Each server support bundle contains several files. The following list illustrates a file collection sample that may appear in a server support bundle. This list does not include the entire collection of files that are typically contained in a server support bundle. It is a partial listing that illustrates the directory structure and describes some of the common files that appear in the support bundle. To explore the contents of an Agent Manager Support Bundle, see Explore the Agent Manager support bundle .
|
A listing of recent changes to the FMS/registry/rules/cartridges/security/etc. It contains information about the before and after states of a configuration object, including rules, registry variables, agent properties, schedules, derived metrics, or thresholds, for changes that occur within the applicable default time range. | |||||
|
A diagnostic snapshot consisting of service status, agent status, thread dump, and other indicators. | |||||
|
A full file listing for all files in the server installation directory. | |||||
|
Defines the “weight” of attached agents. Used to help determine the server load | |||||
|
Various configuration options for running the Management Server as a service | |||||
|
Various log configuration options for the Management Server. | |||||
|
Server restart configuration parameters (if running as a service). | |||||
|
The report is also known as Management Server Performance Summary. It is primarily for use by Quest Support. | |||||
The Support dashboard allow you to create and download Agent Manager support bundles. To download previously created Agent Manager support bundles, use the Support dashboard. For more information about this dashboard, see Create and download server support bundles.
Alternatively, Agent Manager support bundles can be created using the support-bundle command. For syntax information, see the Command-Line Reference Guide.
When you create an Agent Manager bundle, Foglight generates a ZIP file in the <foglight_home>/support/<user_name> directory on the machine hosting the Management Server. The support bundle file name uses the following syntax:
|
1 |
|
2 |
On the Support page, click Create Agent Manager Support Bundle. |
|
• |
Click Download Bundle to immediately download the generated bundle. |
For information on how to create or edit registry variables, see View and edit registry variable settings .
|
1 |
|
4 |
Click Upload to Support. |
|
5 |
Click Upload. |
|
6 |
On the Upload Bundle progress dialog, click Close to close the dialog. The upload will continue. Click Cancel to cancel the upload. |
Each Agent Manager support bundle contains several files. The following list illustrates a file collection sample that may appear in a host support bundle. This list does not include the entire collection of files. It is a partial listing that illustrates the directory structure and describes some of the common files that appear in the support bundle. To explore the contents of a Server Support Bundle, see Explore the server support bundle .
Foglight Configuration
The Federation view contains information about the server federation. Federation is a Foglight feature that addresses the needs of customers who monitor large-scale environments that are naturally partitioned into logical units. Each of these partitions is traditionally served by one Foglight Management Server instance and its distributed clients/agents. Federation enables the use of one Management Server to operate, while using other Management Servers as the data source. The Federation Master Server manages the operation of those units, merging their data into a central model. Clicking an entry in this view drills down to the Foglight Server Topology view.
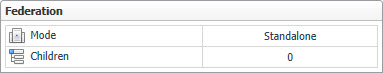
This view displays the following information:
|
• |
Mode tells you whether the current Management Server installation is a Federated Child or a Federation Master in a federated system. |
|
• |
Standalone indicates that your monitoring environment is not federated. |
|
• |
Master indicates that the server is a Federation Server. |
|
• |
Children contains the number of children of the current Management Server installation in a federated system. If this setting shows zero ‘0’, combined with the Mode value of Child/Standalone, that is a good indicator that your monitoring environment is not federated. |
The High Availability view indicates if Foglight is running in High Availability (HA) mode. Configuring Foglight in HA mode allows you to run multiple servers in a JBoss partition offering HA. For more information on starting Foglight in High Availability mode, see the High Availability Field Guide.
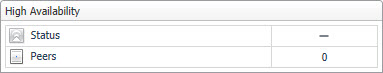
This view displays the following information:
|
• |
|
• |
Peers shows the number of servers in the cluster, not including the current server. |
The Server view displays information related to the Foglight Management Server.
The view shows the following settings:
|
• |
Version. The version number of the Management Server whose configuration items you are viewing. |
|
• |
Build. The build version of the Management Server whose configuration items you are viewing. |
|
• |
Foglight Home. The installation directory of the Management Server on the computer on which it is installed. |
|
• |
JBoss Server Directory. The installation directory of the JBoss application server that is running the Management Server, on the computer on which the Management Server is installed. |
This view contains information about federation settings. The federation settings are defined in the file <foglight_home>/config/federation.config. For more information about this file, see the Federation Field Guide.
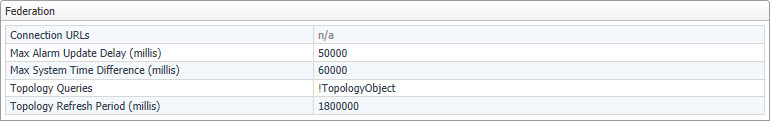
The Federation view displays the following settings:
|
• |
Connection URLs. The JNDI-provider URLs for federated servers. These URLs should use the JNDI JNP port (see Explore the Ports view ), as configured in <foglight_home>/config/server.config on the corresponding federated server. This setting is defined by the JndiURLs parameter in the file <foglight_home>/config/federation.config. |
|
• |
Max Alarm Update Delay (millis). The maximal delay in milliseconds that is allowed for the federation server to check all federated servers for alarm changes. This setting is defined by the MaxAlarmUpdateDelay parameter. |
|
• |
Max System Time Difference (millis). The maximal acceptable difference in system time between federated servers and the federation server, in milliseconds. This setting is defined by the MaxSystemTimeDifference parameter. |
|
• |
Topology Queries. A list of one or more topology queries that identify topology objects that are be merged with the federated topology model. This setting is defined by the TopologyQueries parameter. |
|
• |
Topology Refresh Period (millis). The number of milliseconds between major topology refresh operations. A major topology refresh operation involves re-fetching all relevant topology objects from all federated servers and merging them into the local topology model. This setting is defined by the TopologyRefreshPeriod parameter. |
This view contains information about database settings. The database settings are defined in the file <foglight_home>/config/server.config. For more information about this file, see the Installation and Setup Guide set.
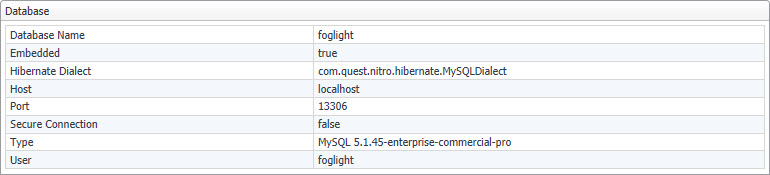
The Database view displays the following settings:
|
• |
Database Name. The name of the database. This setting is defined by the server.database.name parameter. |
|
• |
Embedded. Indicates if the Management Server is using an embedded or external database. Possible values are true or false.This setting is defined by the server.database.embededd parameter. |
|
• |
Hibernate Dialect. The name of the component that defines the database hibernate dialect. |
|
• |
Host. The name of the database host. This setting is defined by the server.database.host parameter. |
|
• |
Port. The port number used by the database. This setting is defined by the server.database.port parameter. |
|
• |
Secure Connection. Indicates if the Management Server is using a secure connection. Possible values are true or false. This setting is defined by the server.database.secureconn parameter. |
|
• |
Type. The type of the database. This setting is defined by the server.database.type parameter. |
|
• |
User. The database user name. This setting is defined by the server.database.user parameter. |
This view contains information about JVM settings.
The JVM view displays the following settings:
|
• |
Name. The name of the Java Virtual Machine (JVM) of the computer in which the Management Server is running. |
|
• |
Version. The version number of the JVM. |
|
• |
Vendor. The name of the JVM vendor. |
|
• |
Architecture (bit). The bit architecture of the JVM. |
|
• |
Options: Add JVM settings to the server.config file by entering and saving them in this field. |
The JVM settings that appear in this view are not the full set. By default, the Foglight launcher sets a number of additional JVM settings. To see all of the JVM parameters, look for them under VM Options in the log file for the current session, <foglight_home>/logs/ManagementServer_<date>_<time>_001.log, as shown in the code listing below that illustrates the default JVM settings.
The OS view contains information about the OS of the machine on which the Management Server is running.
The view displays the following settings:
|
• |
Type. The name and version of the operating system on which the Management Server is running. |
|
• |
Patch. The patch level of the operating system on which the Management Server is running. |
The WCF view contains information about the Web Component Framework (WCF) included with the Management Server.
The view displays the following settings:
|
• |
Version. The version number of the Web Component Framework that is included with the Management Server. |
|
• |
Build. The build version of the Web Component Framework that is included with the Management Server. |
This view shows the email settings that are used by Foglight to send messages to specified recipients. For example, you can configure Foglight to generate and send reports to a specified mail recipient, or email warning messages to Foglight administrators when certain thresholds are reached. For information on how to configure email actions in Foglight, see Configuring email notifications.
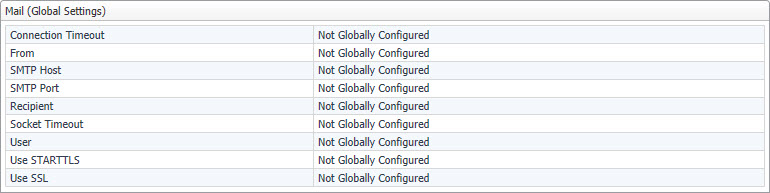
The Mail (Global Settings) view displays the following settings:
|
• |
Connection Timeout. The default connection timeout for sending emails to specified email recipients. This setting is defined by the global value of the mail.connection.timeout Foglight registry variable. |
|
• |
From. The default email address used by Foglight from which emails are sent. This setting is defined by the global value of the mail.from Foglight registry variable. |
|
• |
SMTP Host. The default email host name used by Foglight from which emails are sent when required. This setting is defined by the global value of the mail.host Foglight registry variable. |
|
• |
SMTP Port. The default port number of the email server used by Foglight from which emails are sent when required. This setting is defined by the global value of the mail.port Foglight registry variable. |
|
• |
Recipient. The default email address used by Foglight to which emails are sent when required. This setting is defined by the global value of the mail.recipient Foglight registry variable. |
|
• |
Socket Timeout. The default socket timeout for sending emails to specified email recipients. |
|
• |
User. The default user name for logging into the email server that is used by Foglight to which emails are sent when required. This setting is defined by the global value of the mail.user Foglight registry variable. |
|
• |
Use STARTTLS. Indicates whether the STARTTLS protocol is enabled. Possible values are true or false. This setting is defined by the global value of the mail.smtp.starttls.enable Foglight registry variable. |
|
• |
Use SSL. Indicates whether you want to enable the SSL protocol and use encryption when sending emails from Foglight. Possible values are true or false. This setting is defined by the global value of the mail.use.ssl Foglight registry variable. |
This view lists the ports used by Foglight.
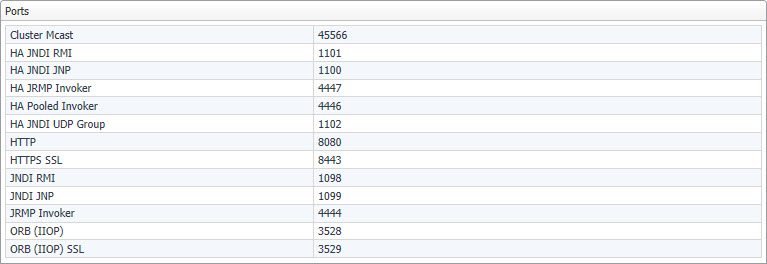
The Ports view displays the following ports:
For complete information about the above ports, such as their default numbers or communication points involved, see Default port assignments.
The following table shows the default port assignments for the ports listed in the Ports view along with a few other ports that are used for communication with the database or internal application ports. The port numbers can be specified at installation time, or after the installation using the configuration parameters in the file <foglight_home>/config/server.config. For more information, see the Installation and Setup Guide set.
|
Description: Port for the Remote Method Invocation (RMI) naming service. | |||||
|
Configuration parameter: foglight.jndi.rmi.port | |||||
|
Description: Port for the bootstrap JNP service. | |||||
|
Configuration parameter: foglight.jndi.jnp.port | |||||
|
From HA Management Server Primary to HA Management Server Secondary and the other way around | |||||
|
Description: Port for the bootstrap JNP service when Foglight is running in the High Availability (HA) mode. For more information about the HA mode, see the High Availability Field Guide. | |||||
|
Configuration parameter: foglight.ha.jndi.jnp.port | |||||
|
From HA Management Server Primary to HA Management Server Secondary and the other way around | |||||
|
Description: Port for the Remote Method Invocation (RMI) naming service when Foglight is running in HA mode. It can be used to observe the network traffic between the Management Server and other computers on the same network. If it finds another JBoss server, it checks the partition name to see if the JBoss server is a primary or a secondary server. For more information about the HA mode, see the High Availability Field Guide. | |||||
|
Configuration parameter: foglight.ha.jndi.rmi.port | |||||
|
From HA Management Server Primary to HA Management Server Secondary and the other way around | |||||
|
Description: Port for the UDP group when Foglight is running in the HA mode. For more information about the HA mode, see the Installation and Setup Guide set. | |||||
|
Configuration parameter: foglight.ha.jndi.udpgroup.port | |||||
|
Description: Corba ORB port used by the Foglight Client. | |||||
|
Configuration parameter: foglight.orb.port | |||||
|
Description: Corba ORB SSL port used by the Foglight Client. | |||||
|
Configuration parameter: foglight.orb.ssl.port | |||||
|
Description: Port for the RMI/JRMP invoker. | |||||
|
Configuration parameter: foglight.jrmp.invoker.port | |||||
|
From HA Management Server Primary to HA Management Server Secondary and the other way around | |||||
|
Description: Pooled invoker port when Foglight is running in the HA mode. For more information about the HA mode, see the High Availability Field Guide. | |||||
|
Configuration parameter: foglight.ha.pooled.invoker.port | |||||
|
From HA Management Server Primary to HA Management Server Secondary and the other way around | |||||
|
Description: Port for the RMI/JRMP invoker when Foglight is running in the HA mode. For more information about the HA mode, see the High Availability Field Guide. | |||||
|
Configuration parameter: foglight.ha.jrmp.invoker.port | |||||
|
Description: HTTP/1.1 connector used for HTTP connections. | |||||
|
Configuration parameter: foglight.http.port | |||||
|
Description: HTTP/1.1 connector used for HTTPS connections. | |||||
|
Configuration parameter: foglight.https.port | |||||
|
Description: Port for the SQL parser. | |||||
|
Configuration parameter: foglight.qp5app.port | |||||
|
Description: Port used by the JavaEE Agent. For more information about the JavaEE Agent, see your Cartridge for Java EE Technologies documentation. | |||||
|
Configuration parameter: Unlike other configuration parameters that are described in this table, whose values can be viewed and edited in the server configuration file, <foglight_home>/config/server.config, this port can be set in the configuration file that ships with the JavaEE Agent. For more information about this file, see your Cartridge for Java EE Technologies documentation. | |||||
|
From HA Management Server Primary to HA Management Server Secondary and the other way around | |||||
|
Description: Cluster multi-cast port. It is used when Foglight is running in the HA mode. For more information about the HA mode, see the High Availability Field Guide. | |||||
|
Configuration parameter: foglight.cluster.mcast_port | |||||
|
1 |
On the navigation panel, under Dashboards, click Administration > Setup > Management Server Configuration. |
|
2 |
|
• |
Font Name: Specifies the name of the imported language, for example, Garuda. |
|
• |
Character Start Range: Specifies the start range of Unicode characters. The value of this field must be integer, for example, 3584 (for Thai). Search for Unicode character ranges yourself and enter the corresponding start range in this field. |
|
• |
Character End Range: Specifies the end range of Unicode characters. The value of this field must be integer, for example, 3711 (for Thai). Search for Unicode character ranges yourself and enter the corresponding end range in this field. |
|
• |
Font Path: Specifies the file folder under which the language file (.ttl) locates. for example, C:\temp. This field is mandatory for the languages that are not installed on your operating system (OS). If you are going to import a language that has been installed on your OS, leave this field blank. |
Some Foglight dashboards have reports associated with them. This allows you to run a report based on the current dashboard. You can generate the report using the Reports menu in the top-right corner.
The Management Server Configuration dashboard is associated with the Management Server Configuration Report. Run this report by selecting Management Server Configuration Report from the Reports menu, and specifying the input parameters in the report wizard.