Monitor Server Performance
The Performance dashboard contains at-a-glance view of Foglight diagnostics. It shows the rate of database inserts, data processing activity, JVM memory usage, server load, and other combinations of views. Certain types of metric patterns displayed on this dashboard can be useful in troubleshooting specific performance problems. For example, a sudden increase in free memory utilization is a good indicator that the amount of incoming data exceeds typical thresholds. To access this dashboard, from the navigation panel, click Dashboards > Management Server > Diagnostic > Performance.
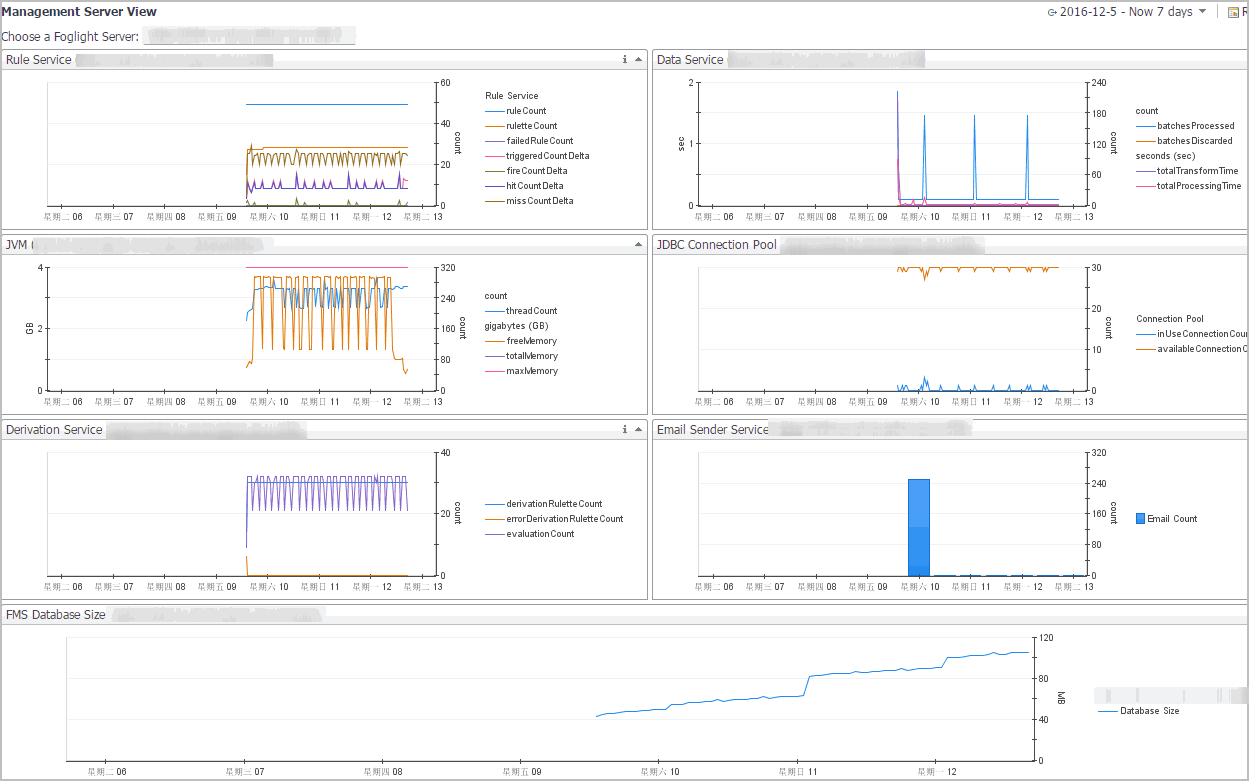
The Management Server View dashboard is useful for examining server performance. Use it to look for root causes of server-related performance problems. To access this dashboard, from the navigation panel, click Dashboards > Management Server > Servers > Management Server View.
Server log files are another source of information that can help you diagnose the root cause of performance-related bottlenecks. They contain information about known events and error conditions as well as verbose or informational messages. The Log Analyzer dashboard allows you to analyze generated log files or download a selected log file to a desired location. To access this dashboard, from the navigation panel, click Dashboards > Management Server > Diagnostic > Log Analyzer.
For more information, see the following topics:
Monitor Agent Manager Performance
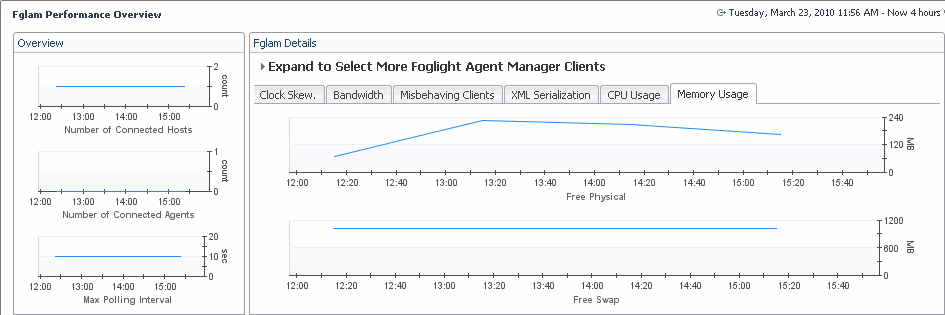
Foglight uses the Agent Manager to communicate with monitored hosts. The embedded Agent Manager can be used to monitor the host on which the Management Server is installed. Your monitoring environment typically includes a number of Agent Manager instances that are installed on different hosts. You can monitor their state using the Performance Overview dashboard. For example, an unusually high number of pending messages in the queue indicates a potential performance bottleneck. To access this dashboard, from the navigation panel, click Dashboards > Management Server > Diagnostic > Agent Manager.
For more information, see the following topics:
Associate Service Objects with Groups and Tiers
To access the Object Groups dashboard, from the navigation panel, click Dashboards > Services > Object Groups.
To access the Tier Definition dashboard, from the navigation panel, click Dashboards > Services > Tier Definition.
For more information, see the following topics:
Back Up and Restore Foglight
Backup and restore processes are important aspects of database administration. The term backing up refers to making copies of data that can be used to restore your system after a data loss event. The backup process includes:
Restoring a physical backup means reconstructing it and making it available to users. You can restore a previous Foglight installation from a backed up copy of the original environment.


