Network Panel
|
|
|
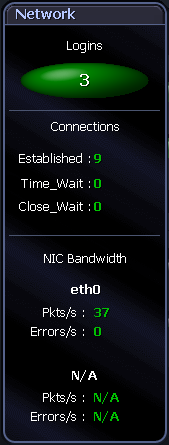
The Network panel shows the logins, connections and movement of data on the Unix system:
Logins
The number of users currently logged on to the machine you are diagnosing.
Connections
The number of external programs with which the machine is currently communicating. The types of connections are:
| Established |
The total number of TCP/IP connections to this machine in the ESTABLISHED state. |
| TIME_WAIT |
The total number of TCP/IP connections to this machine in the TIME_WAIT state, where the local socket has closed, and it is waiting for the remote end to signal that it has done the same. |
| CLOSE_WAIT |
The total number of TCP/IP connections to this machine in the CLOSE_WAIT state, where the remote end of the connection has shut down, and it is waiting for the local end to do the same. |
NIC Bandwidth
| Packets |
The rate of network packets being received and sent for the network card on this host that has the highest rate of packet transfers. |
| Errors |
The rate of erroneous network packets being received and sent for the network card that has the highest rate of packet transfers. |
| Packets |
If more than one network card is installed on this host, this is the rate of network packets being received and sent for the network card that has the second-highest rate of packet transfers. |
| Errors |
If more than one network card is installed on this host, this is the rate of erroneous network packets being received and sent for the network card that has the second-highest rate of packet transfers. |
Data flows between the Network panel and CPU panel
|
Network (Network to CPU) |
Rate of incoming network data
The incoming rate of data to the server. Note: Spotlight contributes to the data traffic as part of its diagnostic activities. |
|
Network (CPU to Network) |
Rate of outgoing network data
The outgoing rate of data from the server. Note: Spotlight contributes to the data traffic as part of its diagnostic activities. |
|
Network Errors (Network to CPU) |
Rate of incoming network errors
The rate at which errors are received from the network. |
|
Network Errors (CPU to Network) |
Rate of outgoing network errors
The rate at which errors are sent from the machine to the network. | |
Related Topics
Spotlight Home Page
Disk Activity Panel
|
|
|
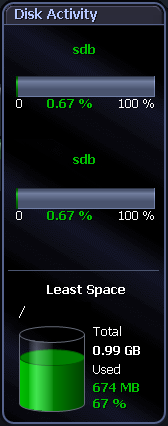
The Disk Activity panel shows information on disk usage:
Activity Guages
|
Activity Gauge (1) |
The percentage activity of the disk with the highest read/write rates. |
|
Activity Gauge (2) |
The percentage activity of the disk with the second-highest read/write rates. |
Least Space
|
/name |
By default, this is the mount point of the disk that has the least amount of free space, and that is not already 100% full. (Because of this, no CD-ROM devices are shown.)
You can configure this control to display the total and used space on ANY available disk on the system. To do so, right-click the control and choose Disk Options from the shortcut menu. |
|
Total |
The total amount of free space that has been allocated to this disk. |
|
Used (MB/GB) |
The amount of disk space that is currently being used by this disk. |
|
Used (%) |
The amount of disk space that is currently being used by this disk, expressed as a percentage. |
Data flows between the Memory panel and the Disk Activity panel
|
Disk I/O (Memory to Disk Activity) |
The number of writes that the system makes to disk per second. |
|
Disk I/O (Disk Activity to Memory) |
The number of reads that the system makes from disk per second. | |
Related Topics
Spotlight Home Page
Alarms
Spotlight
Spotlight is powerful diagnostic and problem-resolution tool for Unix and Linux operating systems. Its unique user interface provides you with an intuitive, visual representation of the activity on your host machine.
For information on Spotlight on Unix, see these sections
| Background Information |
Introductory material to Spotlight on Unix. |
| Connect to a Unix System |
Create / Modify / Delete connections to Unix systems. |
| Home Page |
The Spotlight home page shows the flow of information and commands between various sub-components and the size and status of internal resources such as processes, disk files and memory structures. |
| Alarms |
Spotlight alerts you to problems with your system by issuing an alarm. You can configure Spotlight in the level of severity that constitutes an alarm, to disable an alarm, and the actions Spotlight takes on raising the alarm. |
| Drilldowns |
When you have isolated a problem, you can display a drilldown page, whose charts and tables provide a detailed breakdown of the underlying statistics. |
| View | Options |
Customize Spotlight. |
| Troubleshooting |
Solve problems using Spotlight. |
For information on using Spotlight applications See
Spotlight Basics
Spotlight Alarms
Spotlight Alarms
Spotlight alerts you to problems with your system by issuing an alarm. You can configure Spotlight in the level of severity that constitutes an alarm, to disable an alarm, and the actions Spotlight takes on raising the alarm.
When an alarm is raised Spotlight performs one or more of the following actions:
- Changes the color or intensity of relevant components.
- Gives audible warnings.
- Sends email notifications.
Actions you can take on an alarm being raised include:
- View details of the statistics that caused the alarm in a Spotlight drilldown page. Spotlight Drilldowns
- View the Spotlight online help.
- View details of the alarm in the Spotlight Alarm Log drilldown.
- Snooze the alarm.
- Save the alarm details.
- Filter the list of alarms.
Following are the alarms specific to Spotlight.
Related Topics
Spotlight Alarms
Spotlight Today
Alarms by Time
Alarm Log
