An Oracle RAC cluster where one instance has a higher workload than others in the cluster is not necessarily in a state of imbalance. For example, in a "low load" state, when the total activity across a cluster falls below a minimum threshold level, any lack of balance across the cluster generally is not significant and does not raise a Spotlight alarm.
Note: Spotlight on Oracle RAC uses a statistical technique – the Kruskal-Wallace non-parametric analysis of variance – to determine if the load is evenly balanced across the instances in your cluster. This technique calculates a probability of imbalance based on the relative rankings of load measurements across each instance over an extended time period. The Probability of Imbalance alarm will fire only if the probability of an imbalance is high and the magnitude of the imbalance is significant.
The alarm does NOT fire in response to short-term fluctuations or long-term minor imbalances in load. Nor does it fire if there are short-term spikes that might be caused by a single batch job or SQL statement that uses a high level of the available resources.
To open the Balance page
Click Cluster | Balance Page | Advanced.

Charts on the Advanced Cluster Balance page
The Advanced Cluster Balance page in Spotlight on Oracle RAC contains three ways to view cluster balance.
Notes:
| Chart | Description |
|---|---|
| Probability of Imbalance |
Probability of Imbalance represents Spotlight's calculation that the current cluster imbalance – if any – is significant. (The shape of the probability curve varies with the number of instances in the cluster – the images below represent separate two-instance and multiple-instance clusters.)
If the magnitude of the Z-value (red in these images) is less than that of the boundary values (yellow), the imbalance is not statistically significant and does not raise an alarm. If the magnitude of the Z-value exceeds that of the boundary values, the imbalance IS statistically significant and DOES raise an alarm. Note: When the total activity drops below the minimum threshold level, the label on this chart is shown as No imbalance due to low cluster load. |
| Cluster Balance Metric |
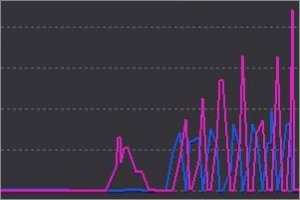
The heading for the Cluster Balance Metric chart is either Logical Reads, CPU Utilization, or Physical Writes, depending on the cluster balance metric you have chosen in the Spotlight on Oracle RAC Options window. This chart contains the same data as its corresponding chart in the Balance page of the Cluster drilldown, except that all values are charted not by time, but in order of size. (Each data series in the chart represents the latest 30 values for the represented instance.) Below is an example of the same information shown in the Balance Page chart and in THIS page.
Balance data ordered by time
Balance data ranked in order of size This ranked data – which Spotlight uses to calculate cluster balance – gives a better indication of whether a specific instance has a consistently higher workload than other instances in the cluster. |
The Top Sessions Grid
Notes:
| Column | Description |
|---|---|
| Instance Name | The instance in the RAC cluster where the session is running. |
| Oracle User | Oracle database account of the started session. |
| OS User | Operating system user for the client. |
| Machine | Name of the computer on which the client is running. |
| DB time (ms/s) | Amount of DB time (time spent processing user calls), in milliseconds per second. |
| CPU (ms/s) | Amount of CPU utilization (ms/s) over the past sampling interval. |
| Log reads/s | Number of logical reads per second in the past sampling interval. This includes all requests for database blocks, irrespective of whether they were found in the database cache. |
| Disk Reads/s | Number of disk reads per second in the preceding sampling interval. |
| PGA Memory (Bytes) | The amount of PGA memory used by the session. |
| Action | The currently executing action name set by DBMS_APPLICATION_INFO.SET_MODULE. |
| Block changes | Total number of block changes the session has performed. |
| Block gets | Total number of current (update) mode reads since the session was established. |
| Client info | Contains the information set by DBMS_APPLICATION_INFO.SET_CLIENT_INFO. |
| Client PID | Operating system process ID for the client program. |
| Client program | The client's program. |
| Consistent gets | Total number of consistent (query) mode reads since the session was established. |
| Failed Over? | In a Real Application Clusters environment, a user can connect to any one of the multiple instances in a cluster. If the connected instance fails, the session can be reconnected automatically to another available instance. There are two types of failover, as this process is known –Connect-time Failover and Transparent Application Failover (TAF). This grid displays information only for TAF failovers. |
| Failover Method |
This specifies how fast a failover occurs from the primary node to the backup node. The failover method can be:
|
| Failover Type |
In a Transparent Application Failover, which occurs when the connected listener fails, the failover can be one of these types:
|
| Fixed table sequence | A number used to identify sessions that have not been idle. The fixed table sequence increases when the session completes a call to a database and a SELECT operation has been performed on a dynamic table. |
| Hit rate | Percentage of read requests that did not require disk I/O. |
| Logon time | The date and time that the user logged on to the database. |
| Module | The currently executing module name set by DBMS_APPLICATION_INFO.SET_MODULE. |
| Resource consumer group | The name of the session's current resource consumer group. |
| Serial # | Serial number of the session. SIDs can be reused after the session disconnects, but the combination of SID and Serial number is always unique. |
| Server | The server type (DEDICATED, SHARED, PSEUDO or NONE). |
| Server PID | Operating system process ID for the Oracle server process. |
| Server program | Oracle server program that supports this session. This may be a dedicated server, shared server, or dispatcher |
| Service Name | Service name of the session. |
| SID | Session identifier for the session. |
| SQL text | Displays the last SQL statement executed by the user. |
| Status | Status of the session, ACTIVE or INACTIVE. |
| User name | Oracle account name of the session. |
| Wait state/time | The status of the wait, and how long it has waited. |
| Waiting location | The details of the wait. |