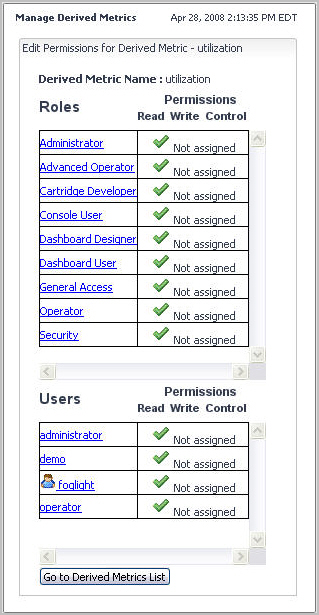
Foglight allows you to control access to derived metrics. For each derived metric you can grant or deny read, write, or control access to roles or users. For more information about security concepts in Foglight, see Managing Users and Security.
Foglight employs the following behavior when it comes to permissions of derived metrics:
|
1 |
|
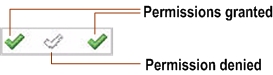
TIP: The Not Assigned icons in the Permissions columns indicate that the role has no permissions assigned to it. |
|
b |
In the dialog box that appears, use the Read, Write, and Control check boxes to assign permissions as required, and click Save. |
|
TIP: Three check marks in the Permissions columns indicate that the role already has permissions assigned to it. |
|
b |
To edit permissions, ensure that Edit is selected and use the Read, Write, and Control check boxes as required. |
|
c |
Click Save. |
|
1 |
|
3 |
|
1 |
|
3 |
Click the Delete Selected button at the bottom. |
|
4 |
For each rule, the Derived Metrics Diagnostics dashboard shows the following information:
|
• |
Derived Metrics: The number of all derived metrics defined in your system. |
|
• |
Derived Metrics with Errors: The number of erroneous derived metrics. |
|
• |
Derivation Rulettes: The number of object instances to which the derived metrics are bound. |
|
• |
Derivation Rulettes with Errors: The number of erroneous derivation instances (rulettes). |
|
• |
Derivation Metrics without Rulettes: The number of derived metrics that are not bound to any object instances. |
|
• |
Name: The derived metric name. |
|
• |
Unit: The unit in which the derived metric is expressed, one of billion, billionth, bit, byte, celsius, count, day, exabyte, gigabyte, hour, kilobyte, megabyte, microsecond, million, millionth, millisecond, minute, month, nanosecond, percent, petabyte, revolution, second, terabyte, thousand, thousandth, trillion, trillionth, or year. |
|
• |
Scope: The derived metric scope. This can give you a better idea on the effect the derived metric has on your monitored system. The scope identifies one or more topology objects that the derived metric calculates. If the scope is not defined, the derived metrics runs against the entire data set which can have a negative effect on overall performance. A derived metric can be scoped to a topology type and can optionally be scoped to specific topology objects of that type. For more information, see Setting the rule or derived metric scope. |
|
• |
Rulettes: A rulette is a derived metric instance that represent the state of the monitoring object to which the derived metric expression applies. This column contains two sub-columns: |
|
• |
Count: The number of scoped objects to which the derived metric is bound. |
|
• |
In Error: The number of erroneous derivation instances (rulettes). Clicking this column shows a list of the object instances to which the error applies. |
|
• |
Cartridge: Identifies the cartridge in which the rule is defined, if applicable. For any rules that you create, this column is blank. |
|
• |
Name: The name of the cartridge in which the rule is defined, including the cartridges included with the server, and any installed cartridges. This column is empty for those rules that you create. |
|
• |
Version: The version of the cartridge in which the rule is defined, including cartridges included with the server, and any installed cartridges. This column is empty for those rules that you create. |
|
• |
Error: If a derived metric is in error, this is usually caused by one of its derived metric calculations being in error. Inspecting individual error messages associated with different derivation instances can often help you diagnose the problem. Start this flow by drilling down on the In Error column and then, in the dwell that appears, clicking the Error column, as described above. |
|
• |
Last Modified: The most recent date and time at which the derived metric was modified. |
From here, you can drill down to a derived metric to see detailed diagnostics about that metric.
|
TIP: To edit rule definitions, in the dwell, click Edit Derived Metric and edit the derived metric, as required. For more information, see Get started: create derived metrics. |
For more information about the Diagnostic Details view that appears, see View derived metric diagnostic details.
This composite view contains the following embedded views:
| |||
| |||
| |||
| |||
| |||
|
| |||
| |||
| |||
|
|
Lists one or more object instances to which the derived metric is bound, and shows information about the derived metric activity, as it relates to each object instance. Selecting a table row shows additional details about the derived metric on the Last Evaluation Result Tab and Observations Tab. | |||||
| |||||
| |||||
| |||||
| |||||
| |||||
| |||||
|
|
Shows the property values associated with the bound object instance. | |||
|
|
Shows information about the object to which the derived metric is bound. | |||
| |||
| |||
| |||
|
|
1 |
|
2 |
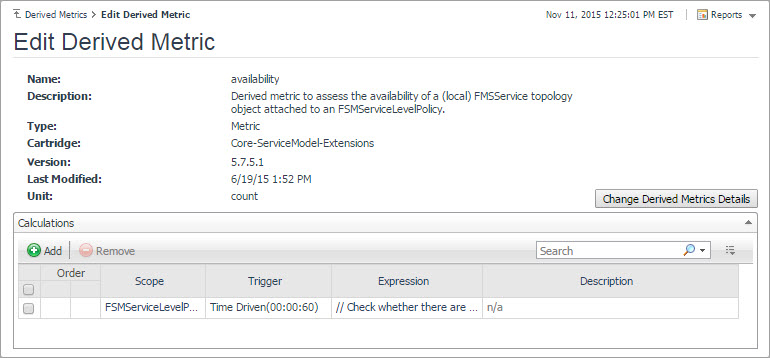
On the Manage Derived Metrics dashboard, click the Derived Metric Name column of the row containing the derived metrics whose definitions you want to view. |
|
TIP: If a derived metric comes with the Foglight Management Server or any installed cartridge, the Cartridge Name and Cartridge Version values indicate the cartridge name and its version. Otherwise, if a derived metric is created using the Create Derived Metric dashboard, this value is blank. |
|
• |
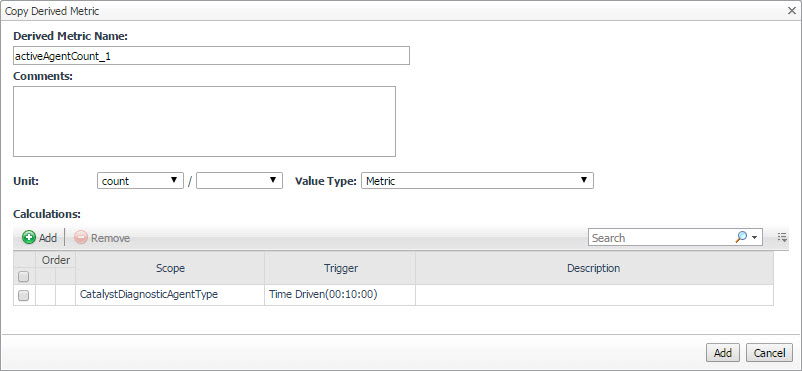
To edit the name of derived metric, type the desired value into the Derived Metric Name box |
|
• |
To make additional modifications, such as adding calculations, see Add calculations to derived metrics for complete instructions. |
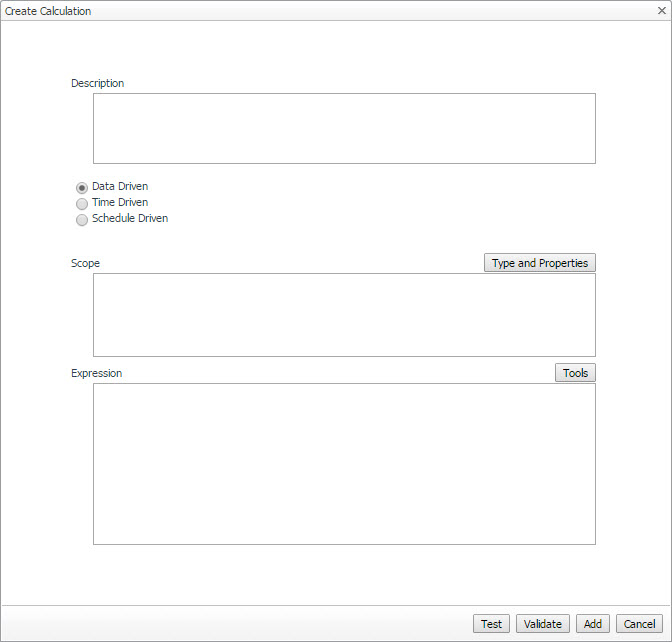
A metric is a specific value that is measured over time. Many derived metrics come included with Foglight and installed cartridges, including activeAgentCount, availability, avg_inserts_per5min, and many others. If none of the existing derived metrics meet your needs, you can create a new one and add it to the derived metric collection.
|
• |
|
• |
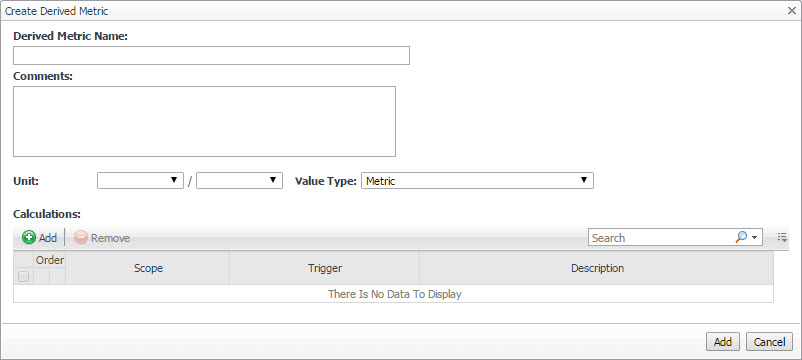
From here, you can proceed to Add calculations to derived metrics.
For detail information on how to scope a rule or derived metric to one or more topology objects, see Setting the rule or derived metric scope.
|
1 |
|
2 |
From here, you can proceed to Trigger derived metrics.
|
• |
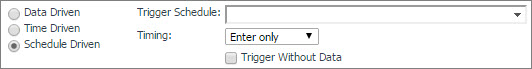
Schedule-Driven Derived Metric. A schedule-driven derived metric is evaluated based on an existing schedule. For more information about schedules, see Associate Metric Calculations with Schedules. |
|
• |
Enter and Exit. Causes the derived metric to be evaluated when the period defined by the schedule begins and ends. |
|
• |
Enter only. Causes the derived metric to be evaluated when the period defined by the schedule begins. |
|
• |
Exit only. Causes the derived metric to be evaluated when the period defined by the schedule ends. |
|
• |
Time-Driven Derived Metrics. A time-driven trigger causes the derived metric to be evaluated once per pre-defined interval. |
|
• |
Data-Driven Derived Metrics. If a derived metric has a data-driven trigger, it will be evaluated every time that data that is used in the expression for the derived metric is sent to the Foglight Management Server. |
|
1 |
|
4 |
To evaluate the derived metric expression in each collection interval, regardless of the existence of data, select Enable Trigger without Data. |
|
1 |
|
2 |
Specify the recurrence interval for the trigger in the hh:mm:ss format. |
|
3 |
To evaluate the derived metric expression in each collection interval, regardless of the existence of data, select Enable Trigger without Data. |
|
1 |
From here, you can proceed to Setting the derived metric type.
|
1 |
In the area immediately below the Derived Metric Calculations list, click Value Type and select Metric from the list that appears. |
|
1 |
In the area immediately below the Derived Metric Calculations list, ensure that both of the Unit boxes are blank. |
The dashboard contains two views: General and Thresholds.
This view indicates the minimal number of hours allocated to IntelliProfile to process data, before generating the initial baseline. By default, this period is 24 hours. It also determines the length of time during which IntelliProfile retains collected data for its learning cycles. By default, this period is 90 days. Increasing this value results in larger storage requirements. Click to edit these values, as required. For more information, see Configuring the baseline.
This view shows the data ranges for Information, Warning, and Critical thresholds. Each data range has a minimum and maximum value pair that represents the percentage of expected average value. For more information, see Edit IntelliProfile thresholds.
The General view on the IntelliProfile dashboard shows the amounts of time allocated to IntelliProfile to process and retain data. Edit these values to suit your needs, as required.
|
1 |
|
2 |
On the IntelliProfile dashboard that appears in the display area, in the General view, set the IntelliProfile is ready after first value. By default, this period is set to 24 hours. |
|
3 |
Set the Allow IntelliProfile to automatically calculate the optimal based on the instance activity of the past value. By default, this period is set to 90 days. |
|
4 |
|
5 |
Click Ok to close it. |
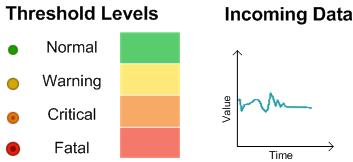
The Thresholds view on the IntelliProfile dashboard shows the data ranges for the default threshold bounds. Each data range has a minimum and maximum value pair that represents the percentage of expected average value.
However, in some cases, threshold ranges do not follow this order. You may have, for example, the Critical threshold value level immediately after Information, followed by the Warning level. When the values overlap, certain levels can take precedents over others, depending on the order in which they are defined, and any overrides. For complete information, see Add bounds to threshold levels.
Threshold level bounds are stored in the Foglight registry. You can edit them using the Thresholds view. The Threshold ranges listed on this view illustrate a default scenario in which the levels are listed in the incremental order relative to the baseline. Every threshold value points to a IntelliProfile registry variable that you can edit using this view.
|
1 |
|
2 |
On the IntelliProfile dashboard that appears in the display area, in the Thresholds view, click and edit the values in the table. |
|
3 |
|
4 |
Click OK to close it. |
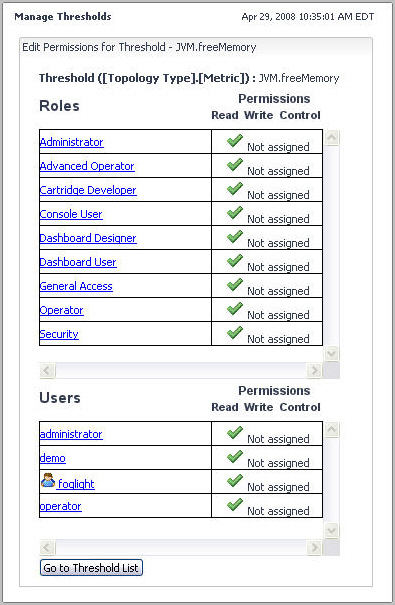
Foglight allows you to control access to thresholds. For each threshold you can grant or deny read, write, or control access to roles or users. For more information about security concepts in Foglight, see Managing Users and Security.
Foglight employs the following behavior when it comes to threshold permissions:
|
1 |
|
TIP: The Not Assigned icons in the Permissions columns indicate that the role does not have permissions assigned to it. |
|
b |
In the dialog box that appears, use the Read, Write, and Control check boxes to assign permissions as required, and click Save. |
|
b |
To edit permissions, ensure that Edit is selected and use the Read, Write, and Control check boxes as required. |
|
c |
Click Save. |
|
1 |
|
2 |
|
3 |
Click Delete Selected. |
|
4 |
|
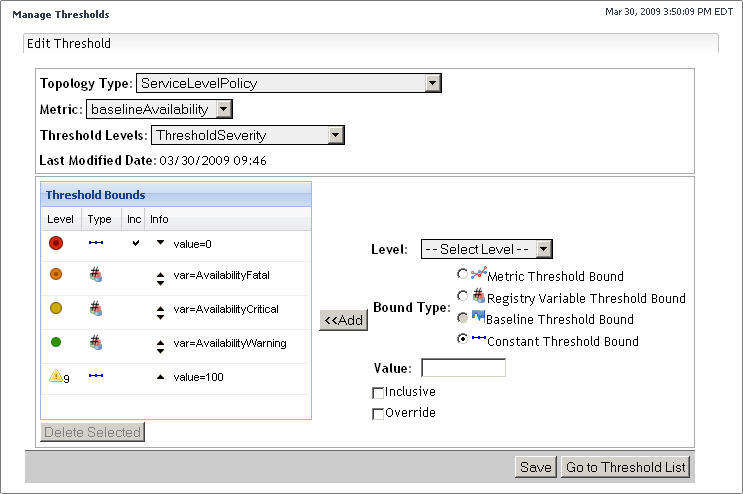
1 |
|
2 |
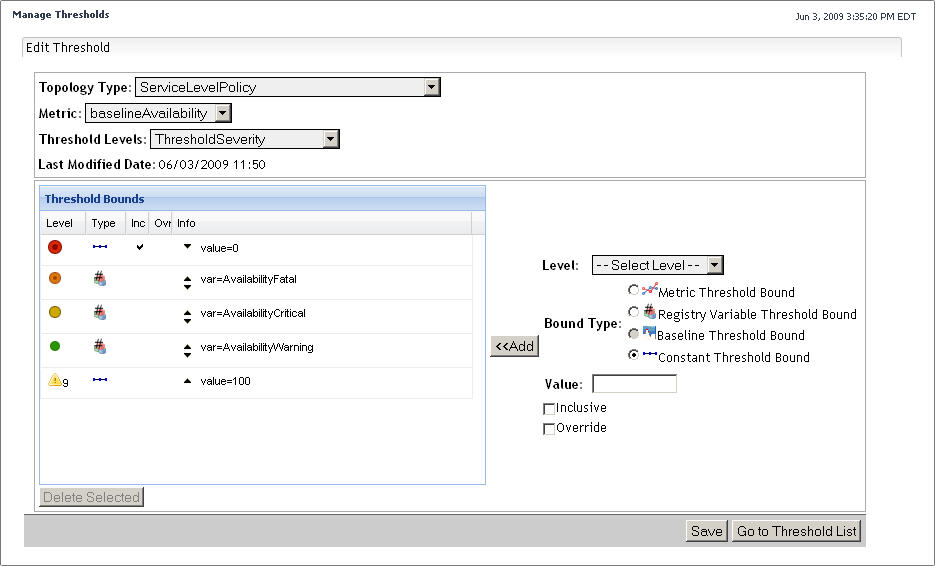
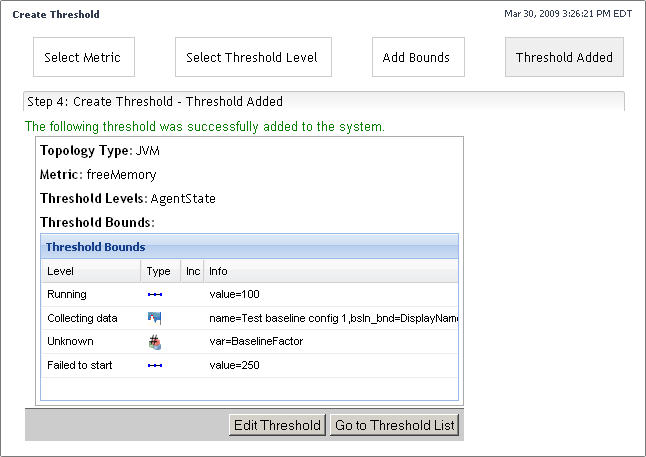
On the Manage Thresholds dashboard, click the Metric column of the row containing the threshold whose definitions you want to view. |
|
• |
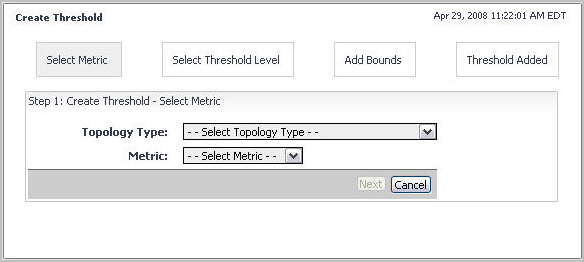
To change the topology type, metric property, or the threshold level, specify the Topology Type, Metric, or Threshold Levels values. |
|
• |
To edit the threshold bounds, use the Threshold Bounds table. For complete instructions, see Add bounds to threshold levels. |
Some thresholds come included with Foglight and installed cartridges, including baselineAvailability. If the existing derived metrics do not meet your needs, you can create a new one and add it to the threshold collection.
|
• |
|
• |
|
4 |
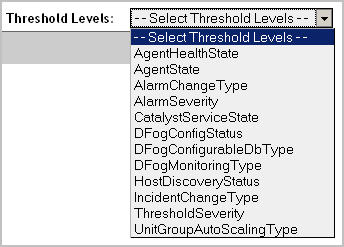
In the Step 2: Create Threshold — Select Threshold Level area, click Threshold Levels and choose one of the following predefined threshold levels from the list that appears. |
From here, you can proceed to Add bounds to threshold levels.
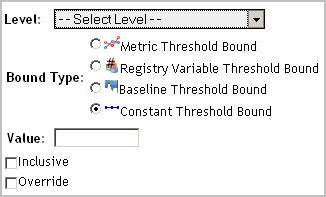
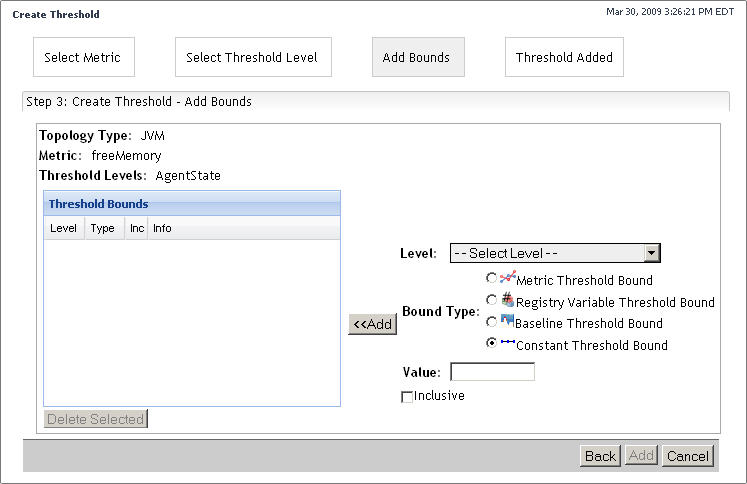
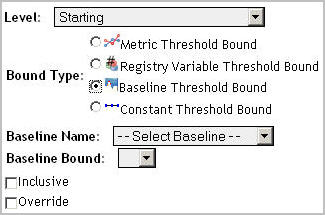
You can have one or more types of threshold bounds in a threshold level.
|
NOTE: This option is only available after installing a baseline cartridge that contains the baseline definitions for the selected metric property. A baseline illustrates the behavior of a metric over time, allowing for its categorization into repeating patterns, such as weekly, monthly, and so on, that can be charted, as required. A baseline cartridge contains the definitions of one or more baselines for a particular metric. Agent developers can write baseline cartridges followed by installing them on the Foglight Management Server. When you add or edit a threshold for a metric, if a cartridge that contains baseline definitions for that metric, the Baseline Threshold Bound option becomes available, allowing you to use one or more metric baseline definitions in the selected metric’s threshold definitions. | |
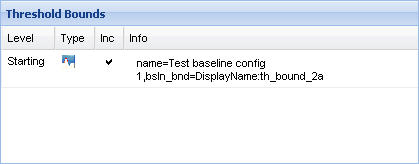
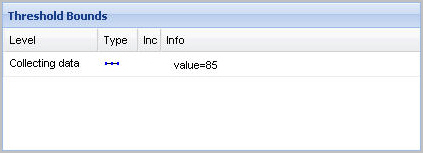
The ranges of threshold levels are created by going over threshold bounds in the order form first to last (from top to bottom in the Threshold Bounds table) and assigning the threshold level of the bound to the range immediately above the threshold bound. In some cases, their ranges do not always follow a progression sequence. This can happen in cases where threshold bounds values are calculated during run-time. For example, a set of threshold bounds can include a mix of constant values and baseline values. As a result, the effective threshold ranges may be different at different time points. It is possible to have valid configurations when threshold ranges minimize to zero '0' or even overlap. When this happens, the default behavior causes the higher threshold level to be applied. To ensure that the appropriate threshold level is applied when their ranges overlap, you can either accept the default behavior, or define a precedence to override the level with a higher value. This can be done with the Override flag. When set for a threshold bound, this flag ensures that the threshold level associated with a particular threshold bound is applied to incoming data even though its value overlap with a higher threshold level.
 | ||
 |
There are no threshold level overrides set for any of the threshold bounds. | |
 |
The Override flag is set for the Fatal threshold level (column four in the Threshold Bounds table on the left), causing it to take precedence over Warning. | |
 |
||
|
2 |
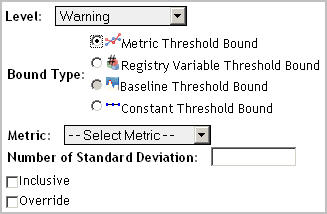
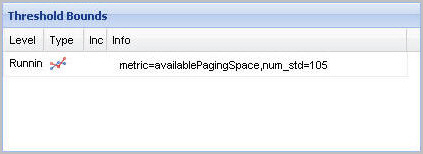
Select the Metric Threshold Bound option. |
|
3 |
Click Metric and select a metric from the list that appears. |
|
5 |
|
6 |
|
7 |
Click Add. |
|
2 |
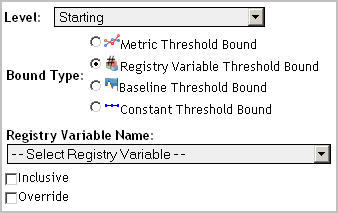
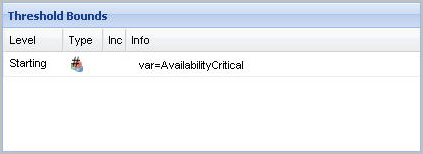
Select the Registry Variable Threshold Bound option. |
|
3 |
Click Registry Variable Name and select a variable from the list that appears. |
|
4 |
|
5 |
|
6 |
Click Add. |
|
2 |
Select the Baseline Threshold Bound option. |
|
a |
Click Baseline Name and select a baseline from the list that appears. |
|
b |
Click Baseline Bound and select a baseline value that you want to use as a threshold. |
|
4 |
|
5 |
|
6 |
Click Add. |
|
2 |
Select the Constant Threshold Bound option. |
|
4 |
|
5 |
|
6 |
Click Add. |
|
• |
Existing thresholds. Click Save. |
|
• |
New thresholds. Click Add. |
By default, the following columns are displayed:
|
• |
Variable Name: The variable name. |
|
• |
Type: Shows the data type of the registry variable. Possible values include Double, Integer, Long, String, Boolean, Timestamp, and Password. For more information about these data types, see Step 3 in Getting started: create registry variables. |
|
• |
Cartridge Name: The name of the cartridge in which the registry variable is defined, if applicable. This column is blank for any registry variables that you create using this dashboard. |
|
• |
Global Default: The global default value assigned to the variable. If the global default points to another registry variable, it starts with the prefix Ref:, followed by the referenced registry variable name. |
|
• |
Scoped Default (TopologyObject): The value assigned to the variable when the variable is scoped to a particular type. To scope on a topology type, click Scope Filter and choose from the available types. |
|
• |
Scheduled: Indicates if a performance calendar is defined for the variable. For more information about performance calendars, see Using performance calendars in registry variable definitions. |
|
• |
Active Schedule: If performance calendars are defined, this column indicates the name of the current schedule, if applicable. |
In addition to these columns, the following columns can also be displayed by clicking and selecting them from the Show Columns dwell that appears.
|
• |
Cartridge Version: The cartridge version in which the registry variable is defined. |
|
• |
Last Modified: The date and time at which the registry variable was last modified. |
For more information about the New Registry Variable Wizard, see Getting started: create registry variables.
For more information about these flows, see View and edit registry variable settings and Copy or delete registry variables.
If you have any registry variables that are no longer referenced in rule conditions, you can delete them from the list. When a registry variable is deleted, all references to that variable in rule conditions and expressions become invalid. This may cause the rule to fail to evaluate. If this occurs, you must manually modify the rule condition or expression. For details, see Writing conditional expressions for time-, data-, or schedule-driven rules and Write a conditional expression for an event-driven rule.
|
1 |
On the navigation panel, under Dashboards, click Administration > Rules & Notifications > Manage Registry Variables. |
|
3 |
|
IMPORTANT: You must use a unique name. |
From here, you can edit the newly copied registry variable to better suit your needs. For example, you can have its value change over time, or scope it to topology types or object instances. For further information, see Using performance calendars in registry variable definitions and Scoping registry variables to topology types or object instances.
|
1 |
On the navigation panel, under Dashboards, click Administration > Rules & Notifications > Manage Registry Variables. |
|
3 |
Click Delete. |
|
4 |
|
1 |
On the navigation panel, under Dashboards, click Administration > Rules & Notifications > Manage Registry Variables. |
|
• |
Name: The name of the registry variable. |
|
• |
Variable Type ClassName: The data type of the registry variable. |
|
• |
Description: A brief description of the registry variable. |
|
• |
Cartridge Name: If the registry variable is defined and included in a cartridge, this field contains the cartridge name in which the registry variable is defined. If you created this variable, this is indicated by the System Value setting that appears in this field. |
|
• |
Cartridge Version: If the registry variable is defined and included in a cartridge, this field contains the cartridge version in which the variable is defined. If you created this variable, this field is blank. |
|
• |
Global Default: The global default value. If the global default points to another registry variable, it starts with the prefix Ref:, followed by the referenced registry variable name. |
|
• |
Performance Calendars List: Shows a list of values that are associated with specific schedules. Having one or more entries in this list causes the registry value to change over time. |
|
• |
Registry Values: Shows a list of values scoped to specific topology types and their instances (if applicable). This causes the registry value to change in rules and derived metrics. |
From here, you can edit the registry variable to better suit your needs. For example, you can have its value change over time, or scope it to topology types or object instances. For further information, see Using performance calendars in registry variable definitions and Scoping registry variables to topology types or object instances.
Many registry variables come included with Foglight and installed cartridges, including AvailabilityCritical, AvailabilityFatal, AvailabilityTarget, and many others. If the existing registry variables do not meet your needs, you can create a new one and add it to the registry variable collection.
The values that you assign to a variable in the wizard must be consistent with the data type that you specify at variable creation time. For example, if you selected the data type Integer, you need to provide a valid integer number when specifying the value.
|
1 |
On the navigation panel, under Dashboards, click Administration > Rules & Notifications > Manage Registry Variables. |
|
A boolean value: true or false. |
||
|
A decimal value between 2-1074 and |
||
|
An integer value between -231 and 231 -1. For example, valid values include 235 and -10000. |
||
|
An integer value that is too large to fit the Integer data type. It can be in the range between -263 and 263- 1. |
||
|
A password value. Prior to storing the value of the Password data type in the registry, Foglight encrypts it and saves the encrypted value in the database. This is useful in cases where you need to secure password values when passing it to command or remote command actions. For example, you create a registry variable of the Password type, MyPassword, and set its value to demo123. Foglight encrypts the registry value, then stores it encrypted in the database (for example, 43-119-184-240-170-150-124-218-30-112-216-76-197-233-188-206). In a function call registry("MyPassword"), Foglight retrieves the registry value from the database in its encrypted form, which secures the password value. |
||
|
Contains a date and time. For example, valid values include 06/12/06, 2006-06-21 15:30:21.0, June 7, 2006 3:08:21 PM. |
|
b |
|
• |
Name: The name of the variable. This is a required value. The registry variable name cannot be longer than 255 characters and must be unique. In addition, the name cannot be changed once the registry variable has been added. This is because registry variables are referred to by their names in rule conditions and expressions and changing them would invalidate these references. However, you can copy a registry variable and give it a different name. |
|
• |
Description: Comments about the variable or its usage. This value is optional. |
|
• |
To specify the Global Default value, click Next. The New Registry Variable Wizard dialog box refreshes. |
|
• |
To specify a new, static value as the global default, select Static Value, and then enter the desired value. |
|
• |
To specify another registry variable as the global default, select Registry Reference, and then select the desired registry variable from the list that appears below. |
|
• |
Variable Type ClassName: The data type of the registry variable you specified in Step 3. |
|
• |
Description: The description of the registry variable you specified in Step 4. |
|
• |
Global Default: The global default value you specified in Step 6. If the global default points to another registry variable, it starts with the prefix Ref:, followed by the referenced registry variable name. |
|
• |
Performance Calendars List: Shows a list of values that are associated with specific schedules. Performance calendars are always associated with the global default. If the global default is not set, performance calendars cannot be added. When you first create a registry variable, this list is empty by default. Having one or more entries in this list causes the registry value to change over time. |
|
• |
Registry Values: Shows a list of values scoped to specific topology types and their instances (if applicable). When you first create a registry variable, this list is empty by default.Having multiple scoped values causes the registry value to change in rules and derived metrics. |
From here, you can edit the newly created registry variable to better suit your needs. For example, you can have its value change over time, or scope it to topology types or object instances. For further information, see Using performance calendars in registry variable definitions and Scoping registry variables to topology types or object instances.
For example, there is a simple rule that applies to the servlets in your application; an alarm fires if the request response time for a servlet exceeds a value set by the ResponseTimeTooLong registry variable that is scoped to the topology type J2EEServlet and with the default scoped value of eight seconds. However, you know that at certain times of day response times for servlet instances are expected to exceed this threshold. At these times, the acceptable response time can be as long as 15 seconds. To prevent alarms from generating as a result of false positives, leave the variable’s scoped value of eight seconds, and create a schedule that recurs daily at the times when it is acceptable for response times for the servlet instances to exceed eight seconds, and specify the alternative threshold of 15 seconds by associating this value with the schedule.
|
1 |
|
• |
|
• |
To reference another registry variable, select Registry Reference, and then select the desired registry variable from the list that appears below. |
From here, you can proceed to Scoping registry variables to topology types or object instances.
|
1 |
|
2 |
|
TIP: Use the Customizer to display two additional columns that are hidden by default: Long Name and Monitoring Agent. Long Name consists of the object name followed by its type name. For example: Broken (AgentHealthState). Monitoring Agent contains the name of the monitoring agent. This information is important if you have monitoring agents whose definitions include objects of the same type and name, like the legacy Cartridge for Operating Systems agents. For more information about the Customizer, see the Foglight User Help. |
|
3 |
Optional — narrow down your scope to a particular object. By default, All Objects is selected, meaning that the registry value is scoped to all instances of the selected type. |
|
• |
|
• |
To reference another registry variable, select Registry Reference, and then select the desired registry variable from the list that appears below. |
|
1 |
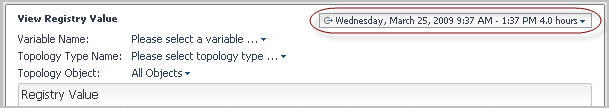
On the navigation panel, under Dashboards, choose Administration > Rules & Notifications > Check Registry Value. |
|
• |
Variable Name: The name of the registry variable whose value you want to view. |
|
• |
Topology Type Name: The topology type with which the registry value is associated. |
|
• |
Topology Object: The object instance of the specified topology type with which the registry value is associated. |
|
• |
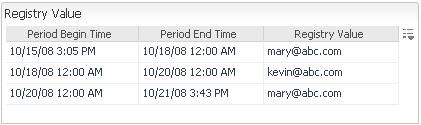
Registry Value: The value to which the variable is set during a specified date and time range. If there are multiple time ranges during which the registry value changes, the table shows the registry value for each range. |
|
a |
|
b |
In the Registry Variable list, scroll down until you find a registry variable, and select that entry. For example, to select the SYSADMIN variable, select SYSADMIN. |
|
a |
|
b |
In the Topology Type list, select a type. |
|
a |
|
b |
In the Topology Object list, select an object instance. |
|
7 |
Optional — Reduce the number of columns that appear in the Registry Value table by clicking and selecting the columns that yo want to appear or hide. |
|
• |
Export as CSV, to export the table contents to a Comma Separated Values (CSV) file. |
|
• |
Export as PDF, to export the table contents to a PDF file. |
|
• |
Export as Excel, to export the table contents to an Excel file. |
|
• |
Export as XML, to export the table contents to an XML file. |
Some Foglight dashboards have reports associated with them. This allows you to run a report based on the current dashboard. You can generate the report using the Reports menu in the top-right corner.
The Manage Registry Variables dashboard is associated with the Registry Variable Report. Run this report by choosing Registry Variable Report from the Reports menu, and specifying the input parameters in the report wizard.