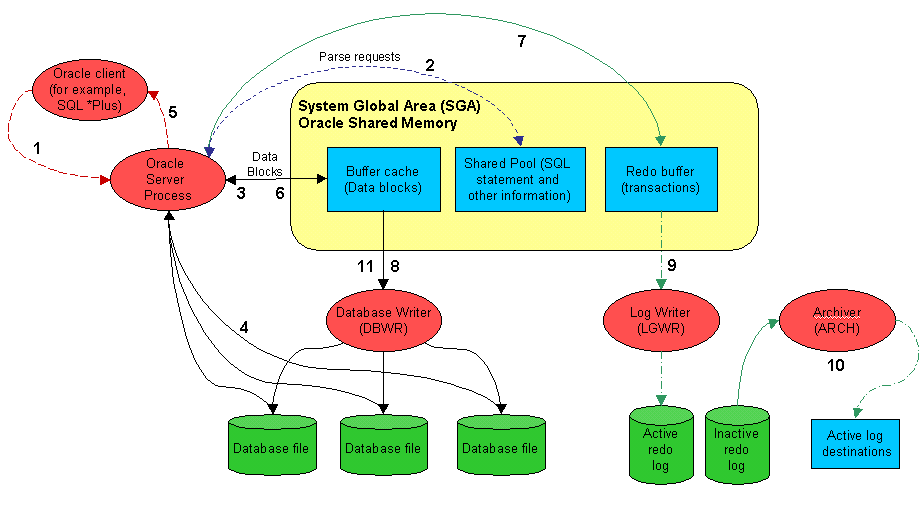
The following diagram illustrates some of the basic components of an Oracle server at the memory, database and disk layers. This architecture has been used to design the Spotlight on Oracle home page.
The numbers indicate the order of the flow of information.
The numbered labels in the Oracle architecture diagram correspond to the following activities:
The Spotlight home page is a visual representation of the status of the major components of the database. The detail at this level is designed to help you locate and identify bottlenecks as they develop. Additionally, Spotlight provides tools that allow you to identify and rectify inefficiency in your database's configuration.
If Spotlight detects that some component of the Oracle database constitutes a performance bottleneck, the corresponding component generates a visual or auditory alarm. The exact appearance of the alarm depends on how you have configured alarm severities. When an alarm is current you can press F1 to display help for the alarm. Clicking the component (on the home page ) displays the relevant drilldown.
The display is based on the Oracle database architecture. Oracle Architecture Overview
Tip: Hover the mouse pointer over a panel component for more information.
To see the Spotlight on Oracle Home Page
 .
. 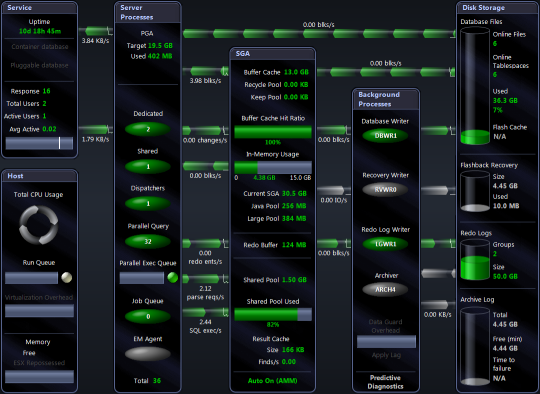
Spotlight Home Page Components
Spotlight alarms indicate when the Oracle database exceeds acceptable performance thresholds.
| Alarm | Description |
|---|---|
|
Spotlight raises the Agent Status alarm when the status of the EM agent is down. OEM is a Web-based database administration and monitoring tool that manages Oracle components and administers Oracle databases. When installed and active, OEM communicates with the databases it administers via a set of EM agent processes under the automated DBSNMP user account. | |
| An Archive Critical Failure alarm indicates that the number of working archive destinations for the database instance is about to fall below the minimum number needed to archive Oracle redo logs successfully. When you see this alarm, you should make space in the archive log destination by purging – or by backing up to an offline medium – any archived files that are not immediately needed. | |
| Spotlight raises an Archive Destination Failed alarm when at least one of the archive destinations specified for redo log files has become full. See Archive Destination Failure alarm below. | |
| An Archive Destination Failure alarm when at least one of the archive destinations specified for redo log files is about to become full. When you see this alarm, you should make space in the archive log destination by purging it, or by backing it up to an offline medium. | |
| When more than one row is retrieved from an Oracle database in a single SELECT (an array fetch), the amount of network traffic associated with SELECT operations is radically reduced. The Array Fetch Size alarm is raised when the array fetch size for the database may be too low. | |
| This alarm indicates that there is unbalanced access to one or more of the disks in the ASM (Automatic Storage Management) disk group that has been allocated to the Oracle instance. | |
| This alarm indicates that the average time taken to perform I/O on the ASM instance has exceeded a specified threshold value. (Service time represents the response time of a disk plus any wait time experienced during disk operations.) | |
| When a Spotlight connection is lost, Spotlight automatically tries to re-establish the connection. The ASM Status alarm indicates that Spotlight is re-establishing its connection to the ASM diskgroup for the Oracle instance. | |
|
The Average Time to Sync a Redo Log Entry alarm (formerly the Average Redo Write Time alarm) is activated when the time taken to write redo log entries exceeds a threshold. Unlike most other Oracle write I/Os, Oracle sessions must wait for redo log writes to complete before they can continue processing. | |
| The Buffer Busy Wait alarm occurs when a session cannot access a block because it is in use by another session. The two most common causes are insufficient free lists for a table or insufficient rollback segments. | |
| The Cache Buffer Chains Latch Wait alarm occurs because contention for the cache buffer chains latch exceeds a threshold. | |
| The Cache Buffer LRU Chains Latch Wait alarm occurs because contention for the cache buffer chains latch exceeds a threshold. | |
|
Spotlight raises the Collection Status alarm when collection of data for the OEM (Oracle Enterprise Manager) stops. Perhaps the server is running low on disk space. The Collection Status alarm often occurs with the Files Pending Upload Alarm. | |
| Oracle sometimes needs to migrate a row in a database from its original block to a new block, or needs to chain an updated row across multiple blocks. These migrated and chained rows cause additional I/O, and the Continued Fetch alarm occurs when the number of these "continued row" fetches exceeds a threshold. | |
| The CPU Busy alarm occurs when the total CPU utilization of the system exceeds a threshold. | |
| The CPU Virtualization Overhead alarm is activated when Virtualization Overhead is greater than a threshold and CPU Usage is 95% or higher. | |
|
The Data Guard Configuration Alarm occurs on a Primary database in an Oracle Data Guard environment. Please supply details of Standby connections to Spotlight so Spotlight can monitor the Oracle Data Guard environment. In monitoring the Oracle Data Guard environment Spotlight can alert you if key elements of the Oracle Data Guard environment are not working, or if Standby instances are lagging behind. | |
| The Dispatchers Busy alarm occurs when all or most dispatcher processes are busy. In an MTS environment, multiple sessions share a smaller number of shared server processes. The servers are usually allocated by a smaller number of dispatcher processes. | |
| This alarm occurs when the Shared Pool is set too small. A possible cause is the use of literals rather than bind variables in SQL statements. You can also increase the size of the Shared Pool. | |
| The Excessive RBS Activities alarm occurs when there are high rollback extent/shrink/wrap activities. | |
|
Spotlight raises the Files Pending Upload alarm when a significant number of XML files are pending upload indicating a problem with the upload process. The strategy for dealing with this alarm is dependent on the OEM control. The OEM control is defined in the Spotlight configuration for OEM. This alarm may occur in conjunction with the Collection Status Alarm. | |
| The Flash Cache Insert Skip: DBWR Overloaded alarm is raised when the ratio of insert skips from the DBWR being overloaded exceeds a threshold. | |
| The Flash Cache Read Latency alarm is raised when the time taken to read a single block from flash cache exceeds a threshold. This may be caused by a low performance flash device. | |
|
The Flash Cache Write Complete Waits alarm is raised when the ratio of 'write complete waits: flash cache' to DB time exceeds a threshold. | |
| The Flashback Buffer Wait alarm indicates that the percentage of available time spent waiting for the Recovery Writer (RVWR) to write data to the flashback logs has exceeded a specified threshold. | |
| This alarm is raised when the amount of used space in the Flashback Recovery Area exceeds a threshold. | |
| The Free Buffer Waits alarm occurs when free buffer waits (as a proportion of total waits) exceeds a threshold. | |
| In-Memory Overhead Alarm | The In Memory CPU Overhead alarm is raised when the in-memory database is using too much CPU. |
| The in memory undo latch is associated with Oracle's relatively new in memory undo (IMU) structures. These structures hold in memory information formerly maintained in rollback (undo) segments. | |
| Spotlight raises an Instance Failed alarm when a specified instance has failed because of an Archiver error. See Archive Critical Failure alarm above. | |
| This alarm fires when the flashback logs in the flashback area do not cover the amount of time specified in the parameter DB_FLASHBACK_RETENTION_TARGET. | |
|
The Job Processes Busy alarm occurs when all or most job queue processes are busy. | |
| This alarm fires when the Large Pool allocation heap is full. The Large Pool is used in MTS for session memory, and can be used by parallel execution and backup processes. | |
| If a session needs to acquire a latch that is held by another session, a latch free wait may occur. The presence of latch free waits may indicate a bottleneck within the SGA. (The specific action depends on the latch.) | |
| These alarm fire when the time spent waiting on library cache latches or library cache pin latches exceeds a threshold. Library cache latches (or mutexes in 10g R2 and above) protect the cached SQL statements and object definitions held in the library cache within the Shared Pool. | |
| The Library Cache Miss Rate alarm occurs when the library cache hit ratio falls below a given threshold. | |
| The Lock Wait alarm occurs when the proportion of time sessions spend waiting for locks exceeds a threshold. | |
| The Log Buffer Space Wait alarm occurs if the amount of time spent waiting for space in the redo log buffer exceeds a threshold. | |
| The Log Switch Time alarm occurs when the amount of time spent waiting for log switch events exceeds a threshold. | |
| The Low Free Physical RAM alarm occurs when the server’s available RAM is low. | |
|
The Maximum Queued Time alarm becomes active when a session has been in the parallel execution queue for longer than the specified threshold. Note: Applies only to Oracle 11g Release 2. | |
|
The Multi-threaded Server alarm occurs when all or most multi-threaded server (MTS) or dispatcher processes are busy. | |
| This alarm is raised when the amount of non-reclaimable used space in the Recovery Area (flashback area) exceeds a threshold. Non-reclaimable files include archived redo logs, which must be backed up before being deleted. | |
| The Oracle Memory on Disk alarm is activated when the amount of guest physical memory mapped to machine memory is less than the current combined size of Oracle's SGA and PGA. | |
| Predictive Diagnostics Oracle Parameters Alarm | The Predictive Diagnostics feature cannot predict the behavior of Oracle databases without the access to Oracle data that is granted by several Oracle parameters. |
| When a Spotlight connection is lost, Spotlight automatically tries to re-establish the connection. The Oracle Status alarm indicates that Spotlight is re-establishing its connection to the Oracle instance. | |
| The Parallel Query Server alarm occurs when all or most parallel servers are busy. Parallel server processes perform work to resolve SQL statements that are being executed in parallel. If all parallel server processes are busy, parallel SQL may be downgraded, or even executed serially, thus increasing its execution time. Spotlight can raise these Parallel Query Server alarms: Parallel Query Servers Busy, Parallel Queries Downgraded, and Parallel Queries Serialized. | |
|
The Parse Ratio alarm is raised when the ratio of parse calls to execute calls exceeds a threshold. Note This alarm is initially disabled; see Total Parse Wait Time Ratio alarm. | |
|
Predictive Diagnostics Bottleneck Collector Alarm |
Predictive Diagnostics alarm (SQL Collector, Bottleneck Collector or Performance Modeling Collector alarm) is raised when the appropriate collection of predictive data has not been scheduled. |
|
This alarm indicates that the customized SQL query use to represent database concurrency within Predictive Diagnostics has returned an error. | |
| The Predictive Diagnostics feature cannot predict the behavior of Oracle databases without the access to Oracle data that is granted by several Oracle parameters. | |
| Redo Allocation Latch and Redo Copy Latch Wait Alarms |
The Redo Allocation and Redo Copy Latch Wait alarms are raised when there is contention for the redo allocation latch and redo copy latch. |
| Result Cache Find/Create Ratio Alarm | When Oracle executes SQL queries, the result cache stores the result sets of specified queries in shared memory for later use. The Find/Create Ratio alarm occurs when the rate of find operations on the result cache drops below the rate of create operations, and indicates that the contents of the result cache are under-used. |
| Result Cache Latch Sleep Ratio Alarm | Spotlight raises the Result Cache Latch Sleep Ratio alarm when the rate of latch sleeps for the Result Cache latch indicates that there is contention on the Result Cache latch, where multiple processes are competing to use the latch and are causing a significant degradation in response time. |
| Row Cache Objects Latch Wait Alarm | The row cache objects latch protects the contents of the row cache; the section of the shared pool to cache dictionary information. |
| Sequential Read Average Time Alarm | The Sequential Read Average Time alarm occurs if the average time for a random datafile read exceeds a given threshold. |
| This alarm fires when the average time that Oracle takes to read a single block of data — typically an index-based lookup — is significantly higher than the average time recorded during calibration. | |
|
The Sessions Queued alarm becomes active when the number of sessions in the parallel execution queue exceeds a threshold. Note: Applies only to Oracle 11g Release 2. | |
| Shared pool latches control access to the shared pool memory map. | |
| This alarm is raised when one user session holds a lock on object(s) in the Shared Pool for a prolonged period, and causes other sessions to wait on the same resource. This "blocking lock" happens rarely. When it does occur, use a SQL query to find the affected sessions. | |
| Spotlight raises an alarm when many shared servers are converted, leaving too few shared servers to meet the demand. Converted shared servers will have a status of WAIT(RECEIVE) in v$shared_server. | |
|
This alarm is raised when there is a problem with the way the OEM configuration has been defined in Spotlight. Correct the values entered in the dialog View | Options | OEM Monitoring. | |
| Spotlight raises the Temporary IO Wait Ratio alarm when the time spent in temporary IO waits is too high as a percentage of the time spent performing user calls on the Oracle database. | |
|
Spotlight raises this alarm when the amount of time spent parsing SQL statements as a percentage of the active database time exceeds a level that may cause latch contention on the shared pool and library cache latches. Note: The Total Parse Wait Time Ratio alarm is available for (Oracle 10.2 and later). When monitoring earlier Oracle systems, consider reactivating the (disabled) Parse Ratio alarm. | |
|
The Unarchived Logs alarm occurs when the number of unarchived redo logs exceeds a threshold. If all online logs need archiving, database update activity can be suspended while the redo log writer waits for the next log to be archived. | |
| When a Spotlight connection is lost, Spotlight automatically attempts to re-establish the connection. Where the Oracle database is hosted on a Unix server, this alarm indicates that Spotlight is re-establishing its connection to the Unix server. | |
| When a Spotlight connection is lost, Spotlight automatically attempts to re-establish the connection. Where the Oracle database is hosted on a Windows server, this alarm indicates that Spotlight is re-establishing its WMI connection to the Windows server. | |
| Spotlight raises the a Write Complete Wait alarm when write complete waits (as a proportion of total waits) exceed a threshold. Write complete waits occur when a session tries to modify a block that is currently being written to disk by the database writer process. |
Note: Spotlight on Oracle Data Guard alarms occur in the Alarm Log of the Primary Database in the Oracle Data Guard environment. See Spotlight on Oracle Data Guard Alarms for more information.
Once a problem is isolated you can display a drilldown page with charts and tables that provide a detailed breakdown of the underlying statistics.
| Drilldown | Click to open | Keyboard Shortcut | Drilldown Pages | Description |
|---|---|---|---|---|
| Top Sessions |  |
CTRL+S |
Top Sessions Page | Parallel Query Sessions Page | DBMS Jobs Page |
The Top Sessions drilldown displays information on the users connected to the Oracle database. Identify the users who contribute most to database activity. Display various details for these sessions, including the SQL statements, locks and resource usage. |
| SQL & Application Workload |  |
CTRL+Q |
Top SQL Page | Array Fetch Page | Parse Activity Page | Sort Activity Page | Trace Files Page | Result Cache Page |
Use the SQL & Application Workload drilldown to select, sort and display SQL statements executed according to specified criteria. |
| Activity |  |
CTRL+Y |
Summary Page | Waits Page | Blocking Locks Page | Lock Activity Page | Latches Page | Server Page | Transactions Page | Rollback Page | Buffer Busy Waits Page | Waiting Events Page |
The Activity drilldown shows Oracle database activity including: waits, waiting events, blocking locks, lock activity, latches, query servers, transactions, rollbacks, and buffer busy waits. Use the Activity drilldown to display overall efficiency and resource usage. In particular, the Event waits chart shows the amount of time database sessions spend waiting for various resources, as well as the amount of CPU being utilized. Efforts at tuning the database are most likely to succeed when they concentrate on the resources being used most heavily. For more information, see Deal With Wait Events. |
| I/O |  |
CTRL+I | Summary Page | Sessions Page | SQL Page | Tablespaces Page | Datafiles Page | Segment Page | Buffer Pool Page | Chains / Migrations Page | The I/O drilldown shows the input and output activity for the Oracle database including: I/O by category, session, SQL, tablespaces, datafiles, segments and row chaining. |
| Configuration & Memory |  |
CTRL+N |
SGA Utilization Page | Shared Pool Utilization Page | Buffer Cache Page | In-Memory Page | Oracle Parameters Page | Alert Log Page | OEM Status Page | OEM Logs Page |
The Configuration and Memory drilldown shows the memory utilization for the Shared Pool and the SGA, the shared pool and buffer cache hit ratios, the Oracle alert log and Oracle parameters. |
| Operating System |  |
CTRL+O |
Use the Operating System drilldown to show information on the performance, processes, and storage on the Spotlight on Oracle connection host. Tip: To open the related Spotlight on Windows or Spotlight on Unix connection, click the arrow next to the Operating System drilldown icon. | |
| Disk Storage |  |
CTRL+D |
Online Redo Page | Tablespace Utilization Page | Recovery Area Page | Archive Destinations Page | Flash Cache Page |
Use the Disk Storage drilldown to display information on online redo logs, tablespace utilization, archive destinations, and Flashback recovery. Right click the tables in the Disk Storage drilldown to open Space Manager. Tools | Space Manager |
| Tuning |  |
CTRL+U |
Use the Tuning drilldown to view information on Oracle memory resources in the Oracle SGA and PGA (System and Program Global Areas), to tune memory resources where feasible, and to view and dynamically tune latch activity for systems with multiple CPUs. | |
| ASM |  |
CTRL+M |
Diskgroups Page | Disks Page | Files Page | Storage Page | Operation Page |
Use the ASM drilldown to diagnose ASM performance. This is relevant if your system uses ASM. ASM (Automatic Storage Management) is a storage management solution from Oracle Corporation that automatically reorganizes data based on statistics collected from usage and user access patterns over time. |
| DTrace |  |
CTRL+R | System Calls Page | Disk IO Page |
DTrace is a dynamic analysis tool for Sun platforms. Spotlight uses DTrace to capture details of the interaction between Oracle and the operating system. Applicable when the Spotlight on Oracle connection is hosted on a Unix operating system (Solaris 10 onwards). Install before use. Install And Configure DTrace Scripts |
| Predictive Diagnostics |  |
CTRL+G |
Collect and analyze performance metrics in order to predict the future behavior of the Oracle database. | |
| Virtualization |  |
CTRL+B |
Activity Page (ESX Server) | Virtual Machines Page (ESX Server) |
Applicable when the Spotlight on Oracle connection is hosted on a virtual machine. Show detailed information on the CPU and memory use of the virtual machine. |
| Pluggable Databases |  |
CTRL+P | Resource Usage |
(Oracle 12c) View the resource usage of pluggable databases. |
| Data Guard |  |
CTRL+W | Standby Connections Dialog. |
Configure Spotlight to monitor Standby databases to this Primary database in an Oracle Data Guard environment. Note: The Data Guard icon is enabled when the current Spotlight on Oracle connection is configured as a Primary database in an Oracle Data Guard environment. |
| Reports |  |
CTRL+R | The Report Wizard generates printable reports. The reports are designed and delivered through SAP Crystal Reports. | |
| Alarm Log |  |
CTRL+L |
The Alarm Log drilldown displays information on the alarms associated with the Windows system, including the name of the component that issued the alarm, the date and time the alarm was logged, and the severity of the alarm. Note: The Alarm Log drilldown is common to all Spotlight applications. The alarms are specific to the current Spotlight connection. Spotlight on Oracle Alarms |