Creating a Model-Based Report
- Click the Report Builder tool button in the Knowledge Portal toolbar; in the models tree in Report Builder, select InTrust.
Any custom report you create will get data from the data source assigned to the selected model. - From the panes on the left, select the objects you are interested in and the fields to obtain the data you need on these objects.
- Drag and drop the objects or fields to the layout area. Refer to the examples below for details.
- To add filters, click Filter in the Report Builder toolbar, and drag and drop the fields you want report data to be filtered by. Refer to the examples below for details.
- Run your report or save it.
Saving a Report
When saving a report created with Report Builder, the report (RDL file) is saved to the default target location on report server where the Report Builder application runs. To make your custom report appear in the report tree in Knowledge Portal, specify QKP\InTrust\Reports as target location.
After you get back to the Knowledge Portal, the report you created will appear in the reports tree. By default, this report will use the data source prescribed by the model it was built on. You can use the Change Data Source option for your custom reports.
|
|
Notes:
|

Two examples of custom report creation are provided in the following topics:
- Example 1: Creating a Report Based on the Generic Perspective
- Example 2: Creating a Summary Report on Group Membership Management
Example 1: Creating a Report Based on the Generic Perspective
To create a report on failed logons using the Generic perspective
- In Report Builder, select the InTrust model, click OK, and select the Generic Events perspective. The entity and its fields are displayed on the left.
The following entity fields will be used in this example to create a custom report on failed logons filtered by computer:- Event ID
- Local Time
- Computer (where the event was logged)
- User
- Events String 2—for User Name of the account who tried to log on
- Events String 3—for Domain this user belongs to
- Events String 7—for Workstation that was used
- Drag and drop these fields to the report layout area.
- Click the Filter button on the Report Builder toolbar.
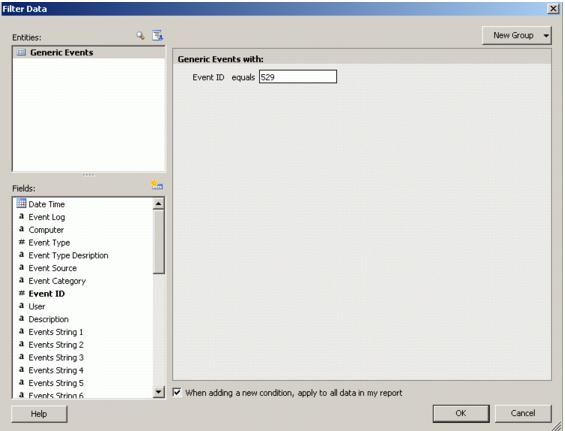
- In the Filter window, drag and drop the Event ID field from the Fields pane to the right pane.
- To report on failed logon events (Event ID 529), set the filter equal to 529 by entering this number in the edit box.
- To prompt the user for the computer name to filter the report by, drag and drop the Computer field to the right pane and configure the parameter as prompted (by selecting this setting from the parameter's shortcut menu).
- Click OK.
- Run the report.
Example 2: Creating a Summary Report on Group Membership Management
You can use Report Builder to create summary reports with either a matrix (cross-tab) or a chart report layout:
- A matrix report layout template presents data in an intersecting format, with totals displayed in the center. It is also known as a cross-tab report.
- A chart report layout template presents data graphically in the form of bar, pie, and line charts.
In a summary report, you can drill down to the details of the selected total.
To help you add totals to a summary report, a special field (Number of <type or name of the entity>) is offered. For example, for the Group Membership Management entity this total will be named Number of Events. If this field is included in a report, a count of corresponding objects is displayed for the group the total refers to.
To create a report on group membership management
- In Report Builder, select the InTrust model, and select its Windows: Account Management perspective.
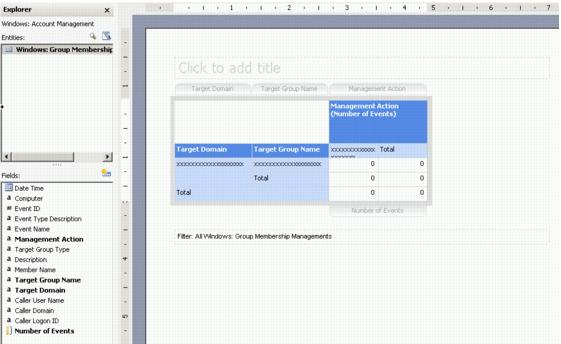
- From the Report layout options, View| Task Pane, select Matrix (cross-tab). Click OK.
- In the Entities pane, select Windows: Group Membership Management entity.
- To group report data by the domain that target group belongs to, drag and drop the Target Domain field to the area marked as 'Drag and drop row groups’.
- Drag and drop the Target Group Name field to place it next to Target Domain on the right.
- Drag-and-drop the Management Action field to the area marked as 'Drag and drop column groups'. This filed is used to show addition or removal of group members.
- To display the total count of management actions, drag and drop the Number of Events field to the area marked as 'Drag and drop totals’.
- To add the drill-down capability from the totals to the details, right-click on the total field and select Edit Formula.
- In the Define Formula dialog, replace the text in the right edit box with the following formula: Count().
- Drag the field (by which you want the total to be counted) to the right edit box, and place it into the formula. In this example, groups total will be counted by the Management Action field, so finally the formula should be Count (Management Action).
- Run the report.
- Click on the total to view the detailed report.