Adding a Column of Aggregate Alarms to the Table
There are two ways of adding columns. You can work with the Columns property as you did in when first creating the table in Tutorial 2, or you can use Config Wizard.
|
2 |
Choose Monitored Hosts and open the view for editing. |
The first page of the Config Wizard appears in the edit pane, allowing you to choose one or more properties that are available for selection.
|
4 |
In the Config Wizard, select the Aggregate State Severity node. |
By choosing aggregateStateSeverity (an integer) we are asking for a value that represents the highest level alarm that is raised for this host. Even though this property contains an integer value, it is replaced by an icon by the default renderer associated with this data type. Thus, the icon shows up instead of the numerical value.
The Config Wizard refreshes.
|
7 |
Optional. Check the result by clicking the Test button. |
|
1 |
Open the Monitored Hosts view for editing. |
|
3 |
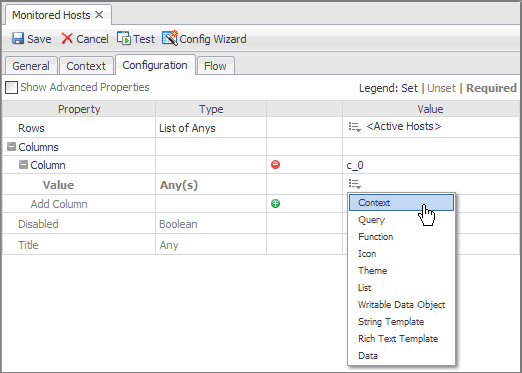
In the Columns row, expand that node and click  . |
|
4 |
In the Value row that appears, click Edit  , and choose Context from the menu that appears. |
You are choosing Context because you want the value that appears to depend on the selected row in the table. Recall from Tutorial 2 that the row supplies a context that identifies a particular host: the one whose name appears in the selected row.
The Edit - Value dialog box appears.
|
5 |
In the Edit - Value dialog box, in the Input Key box, click  , and choose currentRow (Host) from the list that appears. |
|
6 |
In the Path box, click , and choose Aggregate State Severity from the list. |
By choosing Aggregate State Severity (an integer) we are asking for a value that represents the highest level alarm that has been raised for this host. Even though this value is an integer, it is replaced by an icon by the default renderer associated with this data type. Thus, the icon shows up instead of the numerical value.
|
7 |
Click Save both in the dialog box and in the view editor to save the configuration changes. |
Adding a Dependent Page
This task introduces the notion of context inputs. In this example we use a required context input. Contexts are entities that have a data type, so a context must first be declared, much like a variable in a programming language, by giving it a key, which is the name by which it can be referenced, and a type, which is chosen from a list of available types. You will see in this example how a value is assigned to a named context so that it can be passed to the drilldown page through a flow.
Adding a dependent page that relies on a context supplied by the parent page involves these steps:
Adding a Context-Sensitive Dependent Page for the Table of Hosts
In Tutorial 2, we choose a fixed layout container because it has simple properties that are easy to adjust. When, in this tutorial, we need to widen the table it contains, it is a simple matter of dragging the table’s right edge in the Layout tab.
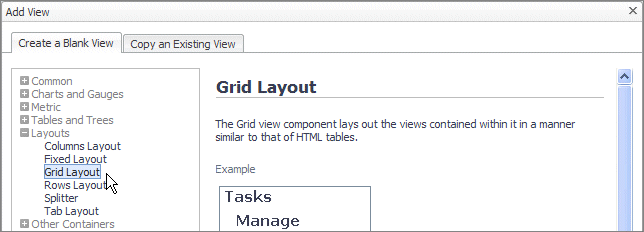
In this example we use a Grid to hold the component we plan to embed. The Grid container permits the placement of designated, already-existing views in cells. A later tutorial illustrates more of the Grid’s properties.
When adding a view, you can specify the row and column in which to place it. The row and column indices are zero-based, so the top-left cell is in column 0 of row 0. We place a single component, a host monitor page, in this cell.
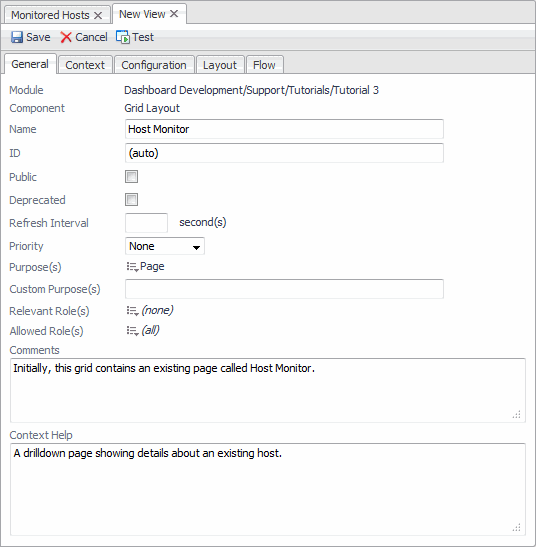
The Host Monitor page is quite complex, but it has the advantage of being one that already exists. You can find it in the Hosts module.
Create a dependent page
The Add View dialog box appears.
|
2 |
Click the Add button in the Module Definitions pane. |
The Add View dialog box appears.
|
3 |
In the Add View dialog box, on the Create a Blank View tab, choose Layouts > Grid Layout. |