
Management Server View and Management Server Metrics
|
1 |
On the navigation panel, under Dashboards, choose Management Server > Servers > Management Server View. |
|
2 |
Click Choose a Foglight Server and select the server from one or more list entries that appear. |
|
• |
Rule Service: Shows the number of rule and derived metric instances bound to data objects. |
|
• |
Data Service: Shows the ability of the server to keep up with incoming data. |
|
• |
JVM: Shows the memory performance of the JVM in which the server is running. |
|
• |
JDBC Connection Pool: Shows the number of database connections that are in use or available at any time. |
|
• |
Derivation Service: Shows the number of derivation rulettes, errors, and evaluation counts. |
|
• |
Email Sender Service: Shows the number of emails that are sent from the selected Management Server. |
|
• |
FMS Database Size: Shows the size of the database. |
Object Groups
Foglight ships with a number of default object groups and subgroups. These groups are marked as Created by Foglight and cannot be changed or deleted.
|
1 |
|
4 |
Ensure the Is Disabled check box is cleared to enable the object group activation. |
|
5 |
Click Create. |
After creating an object group, you need to add one or more subgroups to that group. For more information, see Create an object subgroup.
|
2 |
|
• |
Name: Type a name for the object sub-group that is unique in Foglight. |
|
• |
Description: Optional — Type a description of the object subgroup. |
|
• |
Data Type: Type a regular expression that selects the data type of the subgroup. This is a mandatory value. For example, the following expression selects all Foglight agents with the exception of WindowsAgent instances: |
|
• |
Query Conditions: Optional — Type a filter expression that selects specific object instances only. For example, the following expression selects only those object instances that are already selected by the Data Type expression and whose name starts with ‘tor’: |
|
• |
Is Disabled: Ensure the check box is cleared to enable the subgroup activation. |
|
4 |
Click Test. |
|
5 |
Click Create. |
The object groups that are made available in the Tier Definitions dashboard are based on object groups that were created using the Object Groups dashboard. For more information, see Create an object group.
|
NOTE: New tiers are hidden by default in the Service Operations Console. To display a new tier, in the Service Operations Console, click Customize Service Operations Console, open the Tier Selector tab, and ensure the newly-created tier is selected. For more information about the Service Operations Console, see the related help page. |
|
1 |
The FMS Overview view is a starting point for performance analysis of the Foglight Management Server. It displays information about the database activity, data service performance, JVM performance, and server load in one unified view.
In federated environments, explore the diagnostics for each individual server: Federation Master, Federation Child, or a standalone Foglight Management Server. To do that, click Choose a Foglight Server and select a host from the list that appears.
This view provides more information on:
|
• |
Data load summary (Data Service, Inserts per 5 minutes views). In the Inserts per 5 min embedded view, num_rows_inserted_per5min shows the number of rows inserted every five minutes, while avg_insert_per5min shows one-hour average of num_rows_inserted_per5min. Spikes on the Data Service embedded view often indicate some kind of data processing lull such as a high amount of incoming data (seen as an increase in batchesProcessed), or insufficient resources to process incoming data decrease in batchesDiscarded). |
|
• |
Whether there is enough memory (JVM Memory Usage view). In this view, memory_usage shows the heap memory usage, totalMemory shows the amount of total heap memory, and freeMemory is the free heap memory. A sawtooth on the JVM memory graph is normal, but if the amount of memory freed by a garbage collect (such as the height of the sawtooth) is small, you may need more memory on your system. A large topology results in a high amount of incoming data and a decrease in free memory. The amount of free memory should never be zero. If it does reach zero this is an indication to adjust the server configuration. |
|
• |
Whether the load on the server is too high (Server Load Status view). Server load is mostly determined by the memory usage in the JVM old generation. If the server runs out of memory it will go into an “overloaded” state. A server can be in this state and have some memory available in the JVM new generation. If that is the case, the server discards incoming agent data but can continue to service browser interface requests to some degree. If the server remains to be overloaded, it likely needs to be re-configured to have more memory available, or less workload coming from the browser interface and/or the agents. |
 |
||
 |
Incoming data spikes (batchesProcessed increases), slow processing (batchesDiscarded increases) | |
 |
Too large topology, too much incoming data (freeMemory increases) | |
 |
The Agents view is designed to see what agents you are running, listed by type. By selecting agent types in the tree, a graph showing the number of agents as a function of time is plotted. This graph is handy for viewing changes to the agents, for example if a number of agents that you did not know about were added, or checking if old agents are properly removed.
|
1 |
From the navigation panel, click Dashboards > Management Server > Diagnostic > Performance. |
|
2 |
|
3 |
To view agent connectivity, in the Agent Type column, drill-down to the agent type to view its connectivity. |
The Baseline Measurements view shows internal database I/O statistics related to baseline computation. A metric baseline is the expected metric range for the given time period. When configured, IntelliProfile computes baselines for metrics, and stores that data in the database.
|
1 |
From the navigation panel, click Dashboards > Management Server > Diagnostic > Performance. |
|
2 |
In the display area, click FMS Overview, and in the list that appears, select Baseline Measurements. |
 |
||
 |
||
 |
||
 |
||
 |
||
 |
||
 |
||
 |
||
 |
The Connectivity view shows the Foglight connectivity for the JDBC connection pool and the user session count. It summarizes the database connection state from the perspective of the Foglight Management Server. By looking at this view, you can determine if there are enough JDBC connections to service application requests.
|
1 |
From the navigation panel, click Dashboards > Management Server > Diagnostic > Performance. |
|
2 |
 |
||
 |
The Database Overview view displays the metrics that represent the reads, inserts, and updates of the database rows. These metrics can be used in performance load tests to track the unit load.
Contents of this view includes a drop down to select the host name. Here, you can select a Federation Master, Federation Child, or standalone server. To do that, click Choose a Foglight Server and select a host from the list that appears. It also contains the following embedded views:
|
1 |
From the navigation panel, click Dashboards > Management Server > Diagnostic > Performance. |
|
2 |
 |
||
 |
High load may indicate a possible database bottleneck. Check the database specifications. | |
 |
May indicate a dirty database buffer, possibly because the innodb pool buffer is too small. | |
 |
|
• |
Copy: This view shows the activity of the ParNew garbage collector, used to reclaim memory in the JVM new generation part of the heap. In most cases, there is no need to be concerned with the data on this view unless the numbers become unreasonable (one hour or higher). |
|
• |
ConcurrentMarkSweep: This view shows the activity of the ConcurrentMarkSweep garbage collector, used to reclaim memory in the JVM old generation part of the heap. In general, the values appearing on this view should stay low. An occasional spike does not indicate any problems (such as once a day). If spikes become frequent, the Foglight Management Server memory allocation may need to be adjusted (for example, by balancing the size of new and old generations). In some cases it might be required to increase the overall Foglight Management Server heap. |
|
1 |
From the navigation panel, click Dashboards > Management Server > Diagnostic > Performance. |
|
2 |
The Java Virtual Machine (JVM) view provides full details on the JVM memory activity. This view is particularly useful if you are performing detailed JVM tuning for the different memory spaces.
|
1 |
From the navigation panel, click Dashboards > Management Server > Diagnostic > Performance. |
|
2 |
In the display area, click FMS Overview, and in the list that appears, select Java Virtual Machine Memory. |
The Rulette and Topology view shows how many rules and rule instances are running. Many rulettes, especially as a function of the number of objects, can indicate that you are overloading your server or if some old rules are still running.
|
1 |
From the navigation panel, click Dashboards > Management Server > Diagnostic > Performance. |
|
2 |
In the display area, click FMS Overview, and in the list that appears, select Objects - Rulette and Topology. |
|
1 |
From the navigation panel, click Dashboards > Management Server > Diagnostic > Performance. |
|
2 |
In the display area, click FMS Overview, and in the list that appears, select Script Invocation Time. |
This view shows the Foglight Management Server load metrics and JVM performance.
|
1 |
From the navigation panel, click Dashboards > Management Server > Diagnostic > Performance. |
|
2 |
This view highlights the data and metrics that are being processed in time or getting discarded.
The Service - Data & Message view shows details on data handling of the Foglight Management Server such as the number of skipped messages and the number of discarded metrics. The top-right embedded view shows the percentage of data that is dropped by the server over time, while the top-left embedded view shows the counts of total and skipped messages over time. A high percentage of dropped data can often indicate a server overload. The embedded view in the bottom right is useful for indicating how long data processing is expected to take. If that value grows over time, that is a good indication that the Foglight Management Server cannot keep up with the load from the agents.
|
1 |
From the navigation panel, click Dashboards > Management Server > Diagnostic > Performance. |
|
2 |
In the display area, click FMS Overview, and in the list that appears, select Service - Data and Message. |
The Service - Derivation and Query view shows activity in the derivation and query service such as the number of evaluations, rulettes, errors, and cache performance.
|
1 |
From the navigation panel, click Dashboards > Management Server > Diagnostic > Performance. |
|
2 |
In the display area, click FMS Overview, and in the list that appears, select Service - Derivation and Query. |
The Service - Persistence view shows metric details for the Foglight Management Server that is related to:
|
1 |
From the navigation panel, click Dashboards > Management Server > Diagnostic > Performance. |
|
2 |
In the display area, click FMS Overview, and in the list that appears, select Service - Persistence. |
The Service - Topology & Agent Manager is a two-part view.
|
1 |
From the navigation panel, click Dashboards > Management Server > Diagnostic > Performance. |
|
2 |
In the display area, click FMS Overview, and in the list that appears, select Service - Topology and Agent Manager. |
The UI Query Time view is similar to the Script Invocation Time view (see page 205) except that it shows tables for a query instead of a script.
|
1 |
From the navigation panel, click Dashboards > Management Server > Diagnostic > Performance. |
|
2 |
Some Foglight dashboards have reports associated with them. This allows you to run a report based on the current dashboard. You can generate the report using the Reports menu in the top-right corner.
The Performance Overview dashboard and Management Server View are associated with the Management Server Performance Summary Report. Run this report by choosing Management Server Performance Summary Report from the Reports menu, and specifying the input parameters in the report wizard.
Foglight Agent Manager Performance Overview
The Misbehaving Clients tab displays the disconnections per count for a selected FglAM instance.
The following metrics are displayed for each agent:
|
• |
CDT Node Count: The number of internal data nodes produced by the CDT. Typically, there is one node for each topology object and its metrics, and one global (root) node in the tree. |
|
• |
CDT Value Count: The number of metrics and/or observations produced by the CDT. |
|
• |
Max Stack Depth: The depth of the data tree structure submitted by each agent instance. When a topology object in the data submission refers to another topology object, that increases the depth by one. When the second object refers to a third, the depth is increased again. |
|
• |
Node Count: The number of nodes in the submission. It is a measure of how large the data submission is. |
|
• |
Pre-processing time: The Agent Manager makes two passes over the data submitted by an agent. This is the time spent on the first pass, when the Agent Manager fills in references, validates the submission, calculates missing timestamps, and performs other pre-processing tasks. |
|
• |
Processing time: The length of time it takes the Agent Manager to transfer the data submission to the CDT processing engine of the Management Server. |
Backing Up and Restoring Foglight
TIP: To restore the database after backing it up with the mysql command, use MySQL. To restore the database after backing it up with InnoDB HotBackup and applying the logs, shut down the Foglight Management Server, copy the backup files to <Foglight_home>/mysql/data, and start the Foglight Management Server
| |||||
| |||||
|
TIP: If you want to restore the database to a non-embedded PostgreSQL server, see the “Foglight Two Tier” section followed in this table. | |||||
| |||||
|
ZIP: zip -r Foglight.zip <Foglight_home>
TAR: tar -cvf Foglight.tar <Foglight_home>
TAR.GZ: tar -zcvf Foglight.tar.gz <Foglight_home>
TIP: To restore the database, copy the compressed file to the desired directory and extract this file to the installation directory. If you want to restore the database to a non-embedded PostgreSQL server, see the “Foglight Two Tier” section followed in this table. | |||||
| |||||
The default password is “foglight” that was set during the installation. The database information can be found in the server.database.* settings under <Foglight_home>/config/server.config.
| |||||
| |||||
The default password is “foglight” that was set during the installation. The database information can be found in the server.database.* settings under <Foglight_home>/config/server.config.
| |||||
|
1 |
|
a |
|
b |
Select the Processes tab to inspect the list of processes running on your system. |
|
3 |
|
1 |
Shut down the Foglight Management Server. In a Unix terminal window (for example, xterm) go to the <installation_dir>/bin directory, then type the following command: |
|
3 |
|
1 |
cd to the directory one level above the Foglight installation directory. |
|
NOTE: The archive must include the config, cartridge, support, licence, and scripts directories and all their content. |
|
2 |
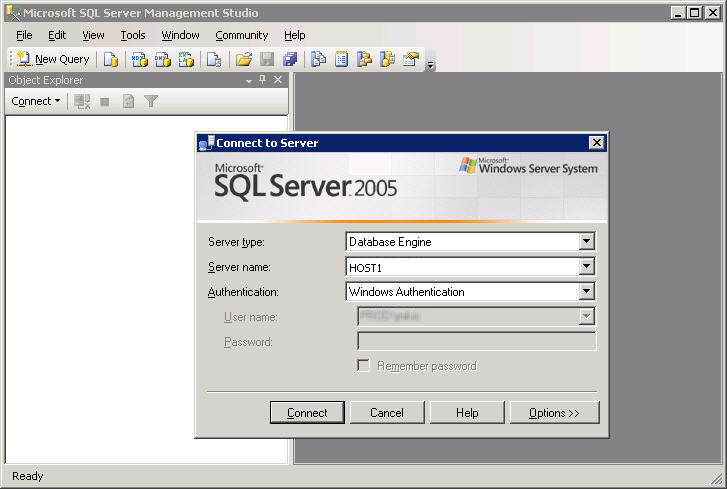
Start the Microsoft SQL Server Management Studio (Start > All Programs > Microsoft SQL Server 2005 > SQL Server Management Studio). |
|
a |
In the Connect to Server dialog box, use the following settings: |
|
b |
|
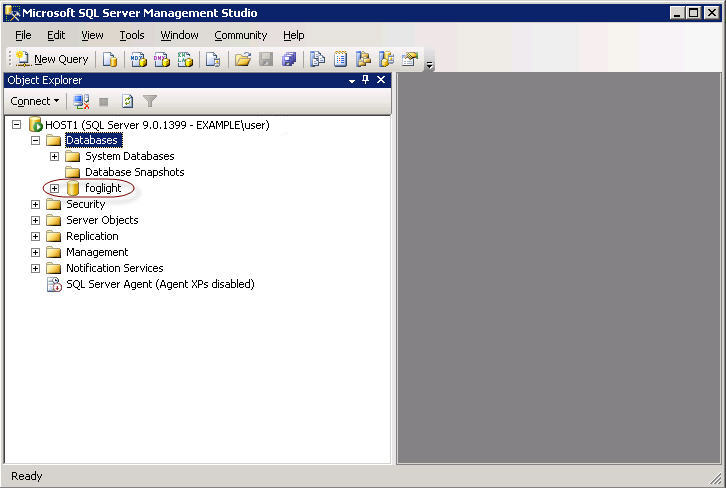
TIP: The Foglight database, represented by the foglight node in the Object Explorer tree, is installed on the MS SQL Server during the Foglight Management Server installation. For additional information, see the Installation and Setup Guide set. |
|
a |
In the Object Explorer pane, right-click the foglight node and from the cascading menus that appear, select Tasks > Backup. |
|
b |
Review the backup settings in the Backup Up Database—foglight dialog box, and if required, make additional modifications. |
|
TIP: The Backup Up Database—foglight dialog box includes two pages, each showing a different collection of settings: General and Options. By default, the General page is selected. To switch between the General and Options pages, select the appropriate page in the Select a page pane in the upper-left. |
|
c |
|
d |
|
6 |
|
2 |
|
a |
|
b |
Select Properties. |
|
c |
|
d |
|
2 |
|
• |
database_user is the name of the database user, as configured by the foglight.database.user parameter in <Foglight_home>/config/server.config. |
|
• |
database_port_number is the database port number, as configured by the foglight.database.port parameter in <Foglight_home>/config/server.config. |
|
• |
database_hostname_or_ip is the name of the computer on which the database is installed, or its IP address, as configured by the foglight.database.host parameter in <Foglight_home>/config/server.config. |
|
• |
database_name is the database name, as configured by the foglight.database.name parameter in <Foglight_home>/config/server.config. |
|
• |
--routines is a flag that ensures that all functions are included in the backup. |
|
• |
backupfile_name is the name of the backup SQL file. |
|
3 |
After the backup SQL file is created, stop the MySQL database by issuing the shutdownDb.bat command from the <Foglight_home>/bin directory. |
|
4 |
Verify that the database is down by verifying that the database process, mysqld.exe, is no longer running using the Task Manager. |
|
2 |
|
• |
|
• |
the backup location: backup.cnf |
|
• |
Foglight_home contains the path to the Foglight installation directory. |
|
• |
path_to_backup_data contains the path to the directory that is to contain the backup files, as defined in Step 1. |
|
3 |
|
NOTE: The above example illustrates the process of backing up a MySQL database on Windows, which uses the back slash character as a directory separator and the dir command to list files. On Unix platforms, use the forward slash to separate directories and the list -l command. |
|
NOTE: The example bellow illustrates the process of backing up a MySQL database on Windows, which uses the back slash character as a directory separator and the dir command to list files. On Unix platforms, use the forward slash to separate directories and the list -l command. |
|
2 |
|
a |
In the Connect to Server dialog box, use the following settings: |
|
b |
|
TIP: The Foglight database, represented by the foglight node in the Object Explorer tree, is installed on the MS SQL Server during the Foglight Management Server installation. For additional information, see the Installation and Setup Guide set. |
|
a |
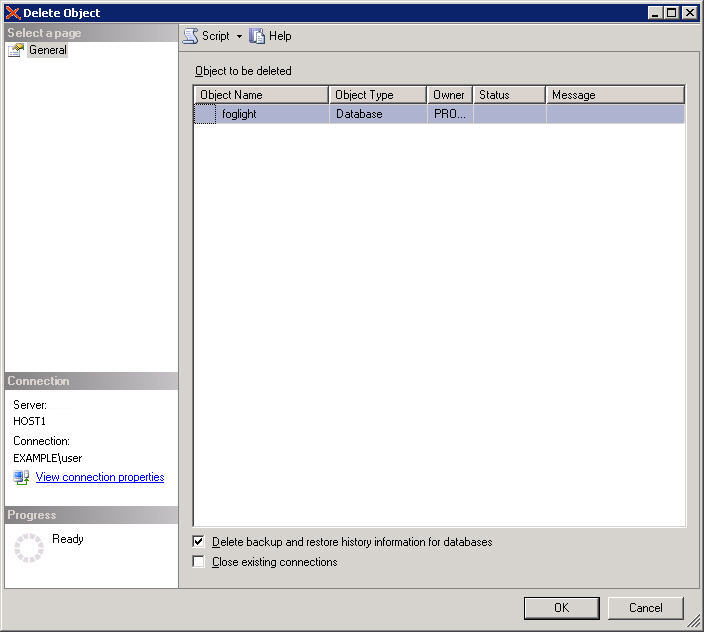
In the Object Explorer pane, right-click the foglight node and from the menu that appears, choose Delete. |
|
b |
Review the backup settings in the Delete Object dialog box, and if required, make additional modifications. |
|
c |
|
a |
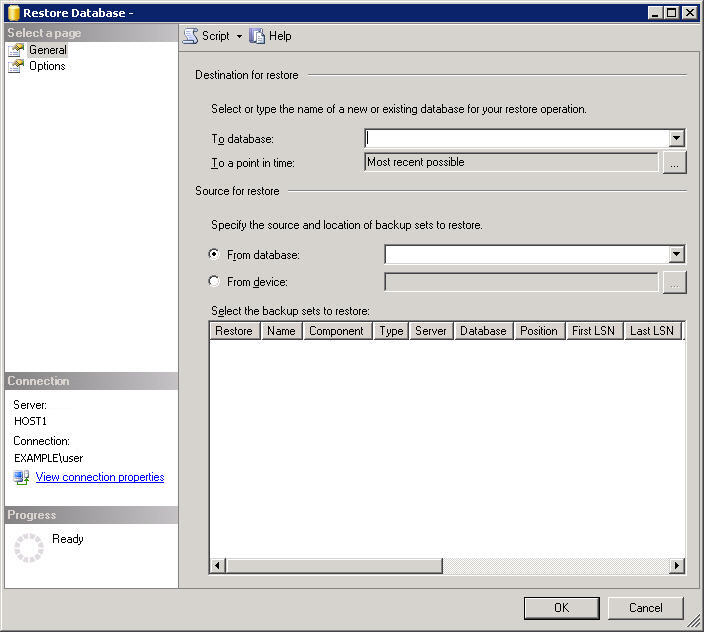
In the Object Explorer pane, right-click the Databases node and from the menu that appears, choose Restore Database. |
|
b |
|
TIP: The default location and name of this file is C:\Program Files\Microsoft SQL Server\MSSQL.1\MSSQL\Backup\foglight.bak. |
|
e |
|
g |
Review the remaining settings in the Restore Database dialog box, and if required, make additional modifications. |
|
h |
|
7 |
|
3 |
After running mysql -u root, execute the following SQL statement: |
|
IMPORTANT: In cases where there are multiple databases, it is important to specify which database this import is associated with by issuing the use <database> command. Failing to do so results in an error. |
|
4 |
After running mysql -u root, run the SQL script created by the backup. Use the following syntax: |
|
• |
Locate the oracle_drop_db.sql script in the scripts/sql directory of the server installation, and then start the script from the command line using the following syntax: |
|
NOTE: The files oracle_drop_dp.sql and oracle_drop_db.sql are included with Foglight when you use an Oracle database, The files are located in the <Foglight_home>/scripts/sql directory. |
|
• |
Issue the drop user command using the following syntax: |
|
NOTE: The dbdump file is the backup file you must create in order to restore your Oracle database (see To back up an Oracle database used by the Foglight Management Server:). |
|
TIP: Change the pg_hba.conf file to ensure that authentication method is password, if needed. For more information about PostgreSQL connections and authentication, see Connections and Authentication. |
|
7 |
Update the server.database.* settings under <folight_home_path>/config/server.config, in order to set up the connection between the Foglight server and the new database. |
|
1 |
From the command-line, change directories (cd) to the directory where you want to install Foglight. |
|
5 |
The previous Foglight installation is now restored.
|
2 |
Copy the backup data that was created with the InnoDB tool, including the data files and the log files, to the directory <Foglight_home>/mysql/data. The backup data and log files use the following naming convention: |
|
• |
ibdata<1-n>. The name of the first data file is ibdata1, of the second ibdata2, and so on. The number of data files depends on the size of the backed up database. |
|
• |
ib_logfile<0-n>. The name of the first log file is ib_logfile0, of the second ib_logfile1, and so on. The number of log files depends on the size of the backed up database and the size of the log file specified in the backup configuration file, backup.cnf. |
If the host name changes, you must obtain a new Foglight license.To receive a new license, send an email to license@quest.com with your contact and site ID information, along with an explanation of why you need a license. Changing only the IP address, while the host name remains the same, does not require a license update.
If the host name changes, you must also update the CATALYST_URL registry variable. This registry variable contains the Management Server host name and port, which are used to build the alarm URLs sent in email message alerts. For more information about email settings, see Explore the Mail (Global Settings) view.
|
2 |
Back up the <Foglight_home> directory. |
|
3 |
Restore the backed up <Foglight_home> directory to the desired location on the new target machine. |
|
5 |
Host name changes only — Obtain a new license file and install it using the browser interface. |
|
6 |
|
2 |
Back up the <Foglight_home> directory. |
|
3 |
Restore the backed up <Foglight_home> directory to a desired location on the new target machine. |
|
5 |
Host name changes only. Obtain a new license file and install it using the browser interface. |
|
6 |
|
9 |
For more information on how to implement these configuration changes, visit the Support Portal at https://support.quest.com/.