Chat now with support
Chat with Support

Enterprise Reporter 3.2.1 - Configuration Manager User Guide

Product Overview Configuring the Configuration Manager
Starting the Configuration Manager Finding Answers and Getting Help An Overview of Enterprise Reporter Communications and Credentials Required Logged In User Details Setting Up Your First Collection Computers Modifying your Deployment Improving the Performance of Your Discoveries What does the status of a node or cluster indicate? Using the Credential Manager Changing the Credentials used by the Enterprise Reporter Server Configuring Global Settings Global Discovery Settings
Understanding Discoveries Creating Discoveries
Step 1. Create the Discovery Step 2. Choose what to include in your discovery (Scopes) Step 2a. Choose scopes for your discoveries
Choosing your Active Directory Scopes Choosing your Computer Scopes Choosing Your Exchange Scopes Choosing Your File Storage Analysis Scopes Choosing Your Microsoft SQL Scopes Choosing Your NTFS Scopes Choosing Your Registry Scopes
Step 2b: Choose scopes for your Office 365 discoveries Step 3. Schedule your Discovery Step 4: Review the summary
Managing Discoveries Troubleshooting Issues with Enterprise Reporter Appendix: PowerShell cmdlets Appendix: Encryption Key Manager Appendix: Log Viewer

Viewing your Discoveries

Ideally, you can configure and schedule your discoveries, and the Configuration Manager will run discovery jobs to provide fresh data to the Report Manager at the intervals you have specified. However, many things may arise that require your attention. For example, a SQL Server® may go offline, or another user may cancel your discovery. Or, you may receive inquiries from users about the freshness of the data, or whether a particular object is included in the data on which they are reporting. You can use the Manage Discoveries pane to view your discoveries and answer questions about data collection.

The main Manage Discoveries pane is a listing of all the discoveries created on any console connected to your Enterprise Reporter server. A snapshot of the current state of each discovery is shown. For each discovery, you can see:

Next Run: The next run of the discovery. This is calculated based on the discovery’s schedule.
Last Run Status: The results of the last run of the discovery - whether it finished, finished but was unable to collect all of the data, or was canceled.
Last Run: When the discovery last completed. This will be empty until the first successful completion of the discovery.
Last Run Time: How long the most recent run of the discovery took to complete. This time is measured from the time the discovery is submitted to the server until the last task finishes running.
Average Run Time: The average of the Last Run Time of the 10 most recent runs of the discovery. Only runs with a Last Run Status of Finished or Finished with failures are included.
Error Suppressions: Indicates when errors have been suppressed for a discovery.

By default, discoveries are grouped by cluster and sorted by discovery name. The current grouping is displayed just above the column headers. An arrow in the column header indicates the current sort.

The Manage Discoveries pane can be customized to display columns in an alternate sequence or to display discoveries with revised grouping, sorting, and filtering. Changes made to the Manage Discoveries pane are automatically saved and used for subsequent logins of the same account.

See also:

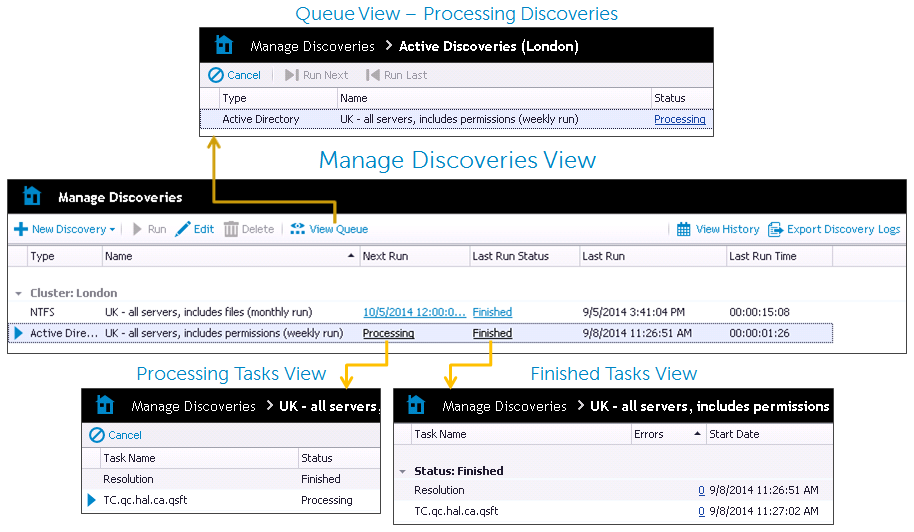
Navigating the Manage Discoveries Pane

The Manage Discoveries pane is actually a series of views designed to allow you to see the progress of your discoveries and to aid in troubleshooting any issues that arise during a collection. In the main Manage Discoveries view, you can create, edit, and run discoveries.

The Manage Discoveries pane uses a drill down approach:

As you drill down into your processing or completed discoveries, a breadcrumb bar helps you understand the context of the information on your screen. At any time, you can click the Manage Discoveries breadcrumb to return to the main Manage Discoveries view. Figure 5 outlines how you can access the details of your completed or processing tasks.

Viewing the History of a Discovery

Enterprise Reporter keeps a history of the last ten runs of each discovery. This can be an aid in troubleshooting — for example, you can see where an error first started appearing in a discovery.

2
Click View History.

What Does the Discovery Status Indicate?

The status of a discovery is largely dependent on the status of the tasks within the discovery. For more information, see What Does the Task Status Indicate? . There are several locations you can view the status of a discovery on the Manage Discoveries page:

The following table outlines the available discovery statuses.

Pending

The discovery is in the queue, but has not yet started processing. This can be as a result of manual or scheduled run of the discovery.

Processing

Once the first task of a discovery is processed (the resolution task), the discovery goes into a processing state, and remains there until the discovery is canceled or all tasks complete.

Canceled

Indicates that the discovery has been successfully canceled.

Finished

Indicates that all tasks have finished with no errors or errors that did occur were suppressed. The Error Suppressions column will indicate when errors are suppressed for the discovery.

Finished with Failures

Indicates that all tasks have finished, but at least one task failed.

Failed

Indicates that all tasks have finished, but they all failed.

Related Documents

The document was helpful.

Select Rating

I easily found the information I needed.

Select Rating