Chat now with support
Chat with Support

Foglight for SQL Server (Cartridge) 5.9.3.10 - User Guide

Introduction to this Guide Using Foglight for SQL Server
Viewing the Databases Dashboard Overview Dashboard Advisories Dashboard Monitoring Data Replication Monitoring SQL Performance Reviewing Memory Usage Reviewing the Instance Activity Reviewing Database Usage Reviewing the Services Using the HADR Drilldown Using the Logs Drilldown Reviewing Configuration Settings Viewing User-defined Performance Counters and Collections
Monitoring Business Intelligence Services Administering Foglight for SQL Server
Configuration Settings Managing Foglight for SQL Server Agent Settings Reviewing Foglight for SQL Server Alarms Generating Reports Monitoring SQL Server instances on VMware servers
Glossary
A
Access methods Adhoc SQL Plans Alarm Alert Allow updates Anonymous subscription Authentication AutoClose AutoGrow Automatic Discovery AutoShrink B Batch BCP (Bulk Copy Program) Blocking Books Online Bound trees Buffer Buffer cache Buffer pull Bulk copy Bulkinsert Bulk load C Cache CAL Calibration Cardinality Cartridge Chart Checkpoint process Client network utility CLR Compile Connect Connection Connectivity software CPU Usage Cursors D Data access components Data file Data storage engine Database Database object DataFlow DBCC DBID DBO Deadlock Disk queue length Disk transfer time Disk utilization DiskPerf Distributing instance Distributor DMO Drilldown DTC DTS E Error log Event alert Execution contexts Extended stored procedures Extent External procedures F File Filegroup File cache Foglight Agent Manager Foglight Management Server Foreign key Forwarded records Free buffers Free list Free pages Free potential Free space Freespace scans Full text search G GAM Ghosted records Growth increment GUID H Hash buckets Hashing Heap Hit rate Hit ratio Host name Host process I I/O Index Indid Integrated security Intent Locks J Job K Kernel memory Kernel mode Kill L Latch Lazy writer Licensing Lightweight pooling Lock Lock area Lock escalation Lock mode Log Log cache Log writer Logical I/O LRU LSN M Master MaxSize MDAC Metric Misc.normalized trees Model Monitor page file N Named pipes Net library NIC Null O OBID Object plans OLAP OLAP service OLTP Optimizer Optimizer cache osql P Page life expectancy Paging Panel Parse Parser Per seat licensing Per server licensing Performance alert Physical I/O Physical read Physical write PID Pinned Plan Plan cache Potential growth Prepared SQL plans Primary key Privileged mode Procedure cache Procedure plans Process Profiler Publication database Publisher Publisher databases Publishing server Pull subscription Pulse Push subscription Q Query plan R RAID Random I/O Read ahead Recompile Referential integrity Relational data engine Replication procedure plans Role Rollback S sa Schema locks Sequential I/O Session Severity SGAM Shared locks Show advanced options SMP Sort, Hash, Index Area SPID Spike Spinner SQL Agent Mail SQL Mail SQL Plans SQL Server Agent SQL Server authentication SQL Server books online Standard deviation Stolen pages Stored procedure Support service SYSADMIN role T TDS TempDB Temporary tables and table variables Threshold Torn page detection Transaction Trigger Trigger plans Truncate Trusted U UMS Unused space User connection area User mode V Virtual log file VLF W Waitfor Windows authentication mode Working set
Reference
SQL PI Repository Cold Backup Procedure SQL Performance Investigator Metrics
Active Time All SQL Agents CPU Usage All SQL Agents Resident Memory Usage Availability Average Physical I/O Operations Average SQL Response Time Backup Recovery Wait Blocked Lock Requests Checkpoint Pages CLR Wait CPU Usage CPU Wait Cursor Synchronization Wait Database Replication Wait Deferred Task Worker Wait Degree of Parallelism Disk Utilization DTC CPU Usage DTC Resident Memory Usage Distributed Transaction Wait Executions Ended Executions Started External Procedures Wait Full Scans Full Text Search CPU Usage Full Text Search Resident Memory Usage Full Text Search Wait Free Buffer Wait Hosted Components Wait IO Bulk Load Wait IO Completion Wait IO Data Page Wait IO Wait Latch Buffer Wait Latch Wait Latch Savepoint Wait Lazy Writes Lock Wait Lock Bulk Update Wait Lock Exclusive Wait Lock Intent Wait Lock Requests Lock Schema Wait Lock Shared Wait Lock Update Wait Lock Wait Log Buffer Wait Log Flushes Log Other Wait Log Synchronization Wait Log Wait Log Write Wait Memory Wait Network IO Wait Network IPC Wait Network Mirror Wait Network Wait Non SQL Server CPU Usage Non SQL Resident Memory Usage OLAP CPU Usage OLAP Resident Memory Usage OLEDB Provider Full Text Wait Other CPU Usage Other Miscellaneous Wait Other Wait Overall CPU Page Life Expectancy Page Splits Parallel Coordination Wait Physical I/O Physical Memory Used Physical Page Reads Physical Page Writes Probe Scans Plan Cache Hit Rate Range Scans Rec Ended Duration Remote Provider Wait Run Queue Length Samples Service Broker Wait Session Logons Session Logoffs SQL Agent CPU Usage SQL Agent Resident Memory Usage SQL Executions SQL Mail CPU Usage SQL Mail Resident Memory Usage SQL Recompilations SQL Response Time SQL Server Background CPU Usage SQL Server Cache Memory SQL Server Connections Memory SQL Server Connections Summary SQL Server Foreground CPU Usage SQL Server Resident Memory Usage SQL Server Swap Memory Usage Synchronous Task Wait Table Lock Escalation Target Instance Memory Total CPU Usage Total Instance Memory Virtual Memory Used
Rules Collections and Metrics

Viewing In-depth Data about the Instance

The Activity drilldown provides two levels of information about the currently diagnosed SQL Server instance:

The Activity panels allow carrying out the following tasks:

Viewing SQL I/O activity datausing the SQL I/O Activity panel, which provides graphical representations of various I/O activities of the currently diagnosed SQL Server instance. For details, see Viewing SQL I/O Activity Data .
Viewing session datausing the Sessions panel, which lists all current SQL sessions and allows viewing session details and locks. For details, see Reviewing Session Details .
Viewing detailed statistics about locks and latches — using the Locks panel, which displays information about all locks, latches and requests on the currently diagnosed SQL Server instance. For details, see Monitoring Locks and Latches .
Viewing statistics about current lock conflicts — using the Blocking (Current) panel, which displays information about all current blocked sessions and lock conflicts, including the connections and resources involved in these conflicts. For details, see Tracking Current Lock Conflicts .
Tracking deadlocks and their implications — using the Deadlocks panel, which displays all of the deadlocks that took place within the selected time range, as well as the databases and objects that were involved in the deadlock situations. For details, see Tracking Deadlocks and their Affected Objects .
Viewing I/O Statistics by Database Files — using the I/O by File panel, which displays current I/O statistics for each SQL Server file. For details, see Viewing I/O Statistics by Database Files .

Reviewing the SQL Server Instance Activity

The SQL Instance Summary panel displays a breakdown for the selected time range (by default: last 60 minutes) of system and SQL Server activity metrics, such as CPU utilization and response time. The display also includes the inner division within the metrics (for example, total CPU utilization compared with CPU utilization by the SQL Server). All metrics are displayed in the Foglight for SQL Server real-time summary; however, the home page displays only the last snapshot (by default: 20 seconds).

This panel allows viewing the source of a performance issue, by displaying the most immediate causes for this issue. Because the SQL Instance Summary panel displays the immediate performance indicators, most in-depth analyses can be carried out in other panels of the Activity drilldown.

The SQL Instance Summary panel allows carrying out the tasks detailed in the following sections:

The Connected Sessions chart displays SQL Server session information. This chart contains a plot graph, which displays the number of SQL Server sessions over time.

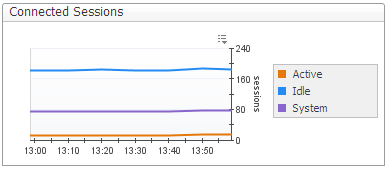
Sessions are broken down into the following categories:

A high number of active user sessions, that is, non-system sessions that are actively processing in SQL Server or that are waiting on locks, may indicate wait events that prevent such sessions from completing their activity and moving to idle state. For example, a CPU-intensive operation may result in a CPU wait event.

A high number of idle user sessions can complicate their management and lead to significant resource consumption, as a result of the update and management operations required for such sessions.

For more in-depth information about the SQL Server’s sessions, go to the Sessions panel, described in section Viewing Session Details .

The CPU Utilization chart displays the amount of CPU being used by SQL Server compared with the total being used by all processes in Windows.

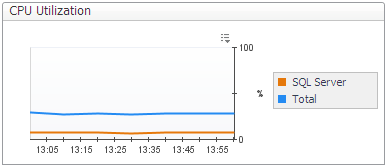
The top-consuming sessions in the system can be reviewed in the Sessions panel, by sorting the Sessions table by the CPU Usage column. For details, see Viewing Session Details .

Viewing the SQL Server I/O activity

The SQL Server IO chart displays the following types of I/O activity:

Under optimal work conditions, the SQL Server uses logical page reads to read pages from the buffer cache. However, required pages that do not yet reside in the cache are being read from disk using physical I/O operations.

A high value for the logical page reads indicates that SQL Server efficiently uses the memory allocated to its buffer cache. A high value for physical page reads, on the other hand, indicates that SQL Server is finding fewer pages already in memory, resulting in the need to perform more disk reads.

The SQL Server IO chart, which displays I/O activity for all sessions and for all SQL Server database files, is actually a summary of two different charts, found in the SQL I/O Activity panel. For details, see Monitoring the SQL Server physical I/O activity and Monitoring the SQL Server logical I/O activity . A more focused display can be obtained using the steps detailed below.

1
Click Activity > Sessions to go to the Sessions panel.
3
1
Click Activity > IO by File to go to the IO by File panel.

Response time is the full time (in milliseconds) it has taken a dummy query (by default: select 1) to get from the application to SQL Server and back.

Every time a real-time sampling interval starts (by default: 5 minutes), a query is sent and its response time value is displayed. Any value higher than 20 ms may indicate a performance issue.

The Response Time chart displays the response over the defined time range.

Figure 17. The Cache Hit Rates chart displays the hit rates for the main SQL Server cache resources.

A hit rate indicates the rate at which SQL Server finds pages already in the cache memory, saving the need to carry out physical reads.

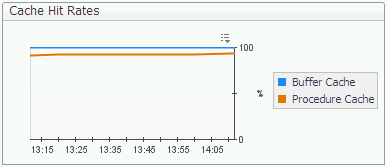
Hit rates are shown for the following cache types:

Buffer Cache — the hit rate for this cache should normally be over 90%.
Procedure Cache — the hit rate for this cache varies widely, depending on how well the application is written.

A buffer cache hit ratio value that continually goes below 90% may indicate the need for reviewing the memory settings.

Low procedure cache hit rates may indicate inefficient use of SQL cache memory, which increases the need for compilation.

To further investigate the reasons for the low cache hit rates, see Monitoring Buffer Cache-related Data and Monitoring Plan Cache-related Data . To review how the cache hit rate affects the number of compiles and recompiles, review the Call Rates chart.

Figure 18. The Call Rates chart displays the rate at which various events are occurring in SQL Server.

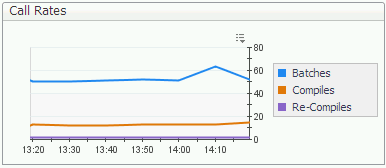
The following metrics are charted:

When many recompiles take place, the SQL Server’s CPU can become overloaded, slowing down everything running on that computer. When a predefined threshold is exceeded, the Recompiles alarm is invoked. The Re-Compiles metric of this chart allows viewing whether the recompiling issue is a persistent one. For further details, see Recompiles Alarm .

Viewing SQL I/O Activity Data

The SQL I/O Activity panel provides information, represented graphically by charts, about the physical and logical activity of all SQL Server’s sessions. In addition, this panel includes a chart that displays various statistics relating to how SQL Server data is being accessed and updated (for example, page splits and page allocations). An extra chart featured in this panel, Disk Queue Length, displays the disk activity for each logical disk, including activity generated by non-SQL Server processes.

The charts displayed in this panel provide a summary of physical and logical I/O activity for all sessions. To view a breakdown of these activities per session, go to the Sessions panel and click the requested session.

The SQL I/O Activity panel allows carrying out the tasks described in the following topics:

The following table identifies each of the main elements of the Foglight for SQL Server real-time summary page, and provides a link to display more information, corresponding to the logical dataflow within the Foglight for SQL Server Instance Homepage.

Instance properties

Identifying the Instance

Sessions pane

Monitoring General Session Statistics

Background Processes pane

Monitoring Background Processes

Workload

The workload (average active sessions) graph for the SQL Server instance, plotted over the specified time range (by default: last 60 minutes).

Process activity

Data flows.Monitoring total activity

Memory Activity pane

Monitoring the SQL memory management

Disk Storage pane

Monitoring the disk storage

Physical I/O operations

Tracking physical I/O activity

The main groups (panes) of gathered icons and gauges, which represent the main activity areas in the SQL connection process, are as follows:

Related Documents

The document was helpful.

Select Rating

I easily found the information I needed.

Select Rating