
Benchmark Factory Run Reports
Benchmark Factory Run Reports is a separate executable that provides a comprehensive and detailed collection of database load testing results. With Benchmark Factory you can drill down into a database to view a wide array of information and statistics that gives you accurate insight into database performance. Run Reports Viewer allows you to access Benchmark Factory load testing results.
Note: Three instances of Run Reports can be viewed at one time.

Cutting and Pasting of Run Reports
From Benchmark Factory run reports you can cut and paste test results into the Clipboard.
Testing Server Throughput
Server throughput is the measurement of database capacity. Benchmark Factory allows you to view a variety of server throughput statistics that include:
- Transaction/Second (TPS)
- Transaction Time
- Bytes/Second (BPS)
- Rows/Second (RPS)
- Total Bytes
- Total Errors
- Total Rows
- Response Time

Testing SQL Scalability
The Benchmark Factory transaction comparison graph provides users with a comparison of the individual transaction performance as they compare to each other. This is most useful when analyzing a SQL Scalability test.

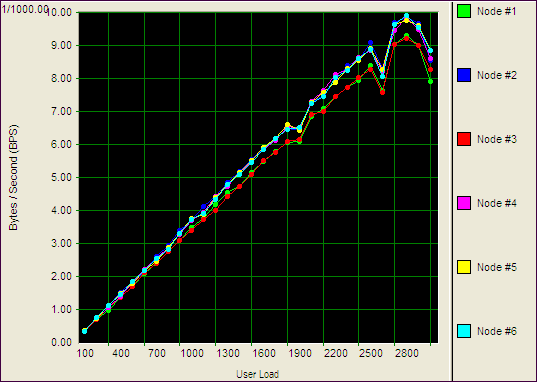
Testing Real Application Clusters
Benchmark Factory allows you to load test Oracle Real Application Clusters (RAC) to determine system capacity. The cluster performance graph allows users to view the performance of individual nodes.
Overview
Benchmark Factory Run Reports is a separate executable that provides a comprehensive and detailed collection of database load testing results. With Benchmark Factory you can drill down into a database to view a wide array of information and statistics that gives you accurate insight into database performance. Run Reports Viewer allows you to access Benchmark Factory load testing results.
Note: Three instances of Run Reports can be viewed at one time.
Cutting and Pasting of Run Reports
From Benchmark Factory run reports you can cut and paste test results into the Clipboard.
Testing Server Throughput
Server throughput is the measurement of database capacity. Benchmark Factory allows you to view a variety of server throughput statistics that include:
- Transaction/Second (TPS)
- Transaction Time
- Bytes/Second (BPS)
- Rows/Second (RPS)
- Total Bytes
- Total Errors
- Total Rows
- Response Time
Testing SQL Scalability
The Benchmark Factory transaction comparison graph provides users with a comparison of the individual transaction performance as they compare to each other. This is most useful when analyzing a SQL Scalability test.
Testing Real Application Clusters
Benchmark Factory allows you to load test Oracle Real Application Clusters (RAC) to determine system capacity. The cluster performance graph allows users to view the performance of individual nodes.
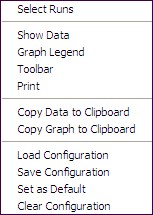
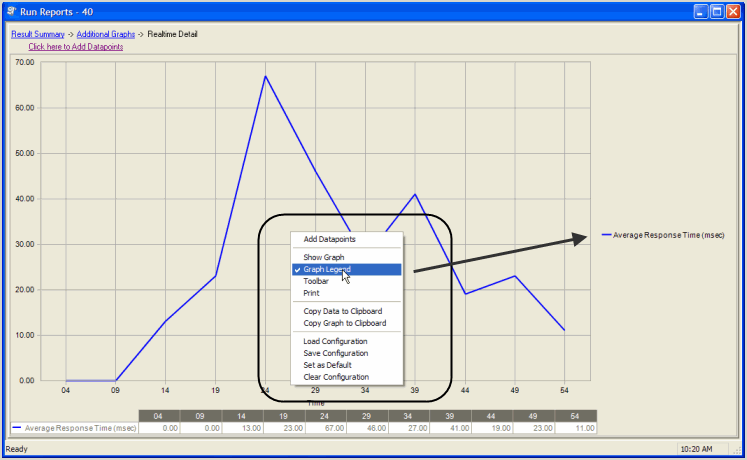
Changing Graph View
Right-clicking on a Benchmark Factory graph displays a drop-down that allows you to customize graph settings. Whether you are viewing a real-time graph or one in Benchmark Factory Run Reports, Benchmark Factory uses the same graphing tool. In most cases you will find that the graphs are presented in the most meaningful form (Line Graphs or Bar Graphs based on the data being presented.)
|
|
Displays Benchmark Factory Run Reports
Shows in a data form or graph form Loads a saved graph configuration |
Show Data/Show Graph
Toggling to Graph displays the data in graph form.
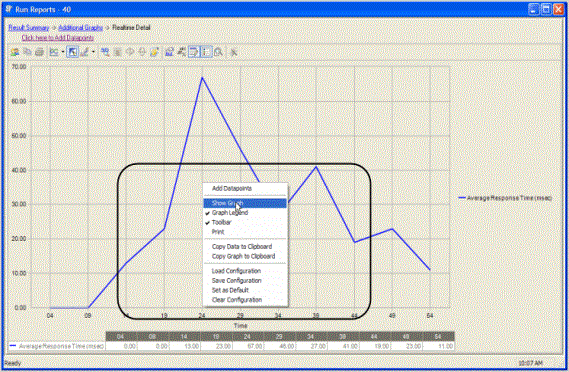
Graph Legend
Toggling to Graph Legend displays a legend on the side of the graph.
Toolbar
Toggling to Toolbar displays the graph toolbar.
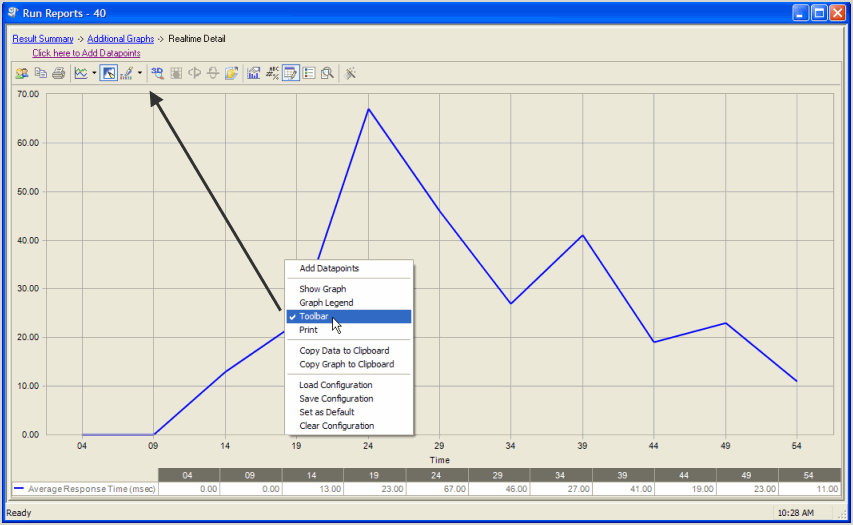
Choosing Print displays the Print Dialog.
Copy Data to Clipboard
Copies the data to the clipboard.
Copy Graph to Clipboard
Copies the graph to the clipboard.
Load Configuration
Benchmark factories graphs allows you to save graph configurations.
Save Configuration
Saves a graph configuration.
Set as Default
Sets a configured graph as default.
Clear Configuration
Clears a graph configuration.
Run Reports Viewer
Open the Run Reports viewer to view a list of all test result reports.
To open Run Reports
- From the Benchmark Factory console click Tools | Run Reports. The Run Reports viewer opens.

See Using Benchmark Factory Run Reports for more information.
Importing and Exporting Benchmark Factory Test Results from Run Reports
From Run Reports, you can import or export run results.
To import or export testing results:
- Open Run Reports.
- Click on the required Import or Export button.

Navigate to the required folder to import or export the test results.
- Click Open or Save.