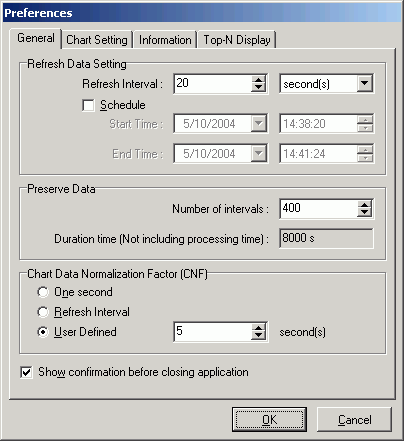
General Tab
The General tab on the Preferences window for the Performance Monitor is for setting the statistics retrieval frequency for how often the statistics are refreshed, how many refresh intervals are saved and the normalization factor for accurate comparisons of the statistics.
Refresh Data Setting
The Refresh setting allows you to collect the database performance statistics at regular intervals once you have started the monitoring process. If you have selected the Schedule option, then the monitoring starts and ends at the specified time. If the Schedule option is not selected, then the monitoring starts immediately and does not end until you stop it.
Refresh Interval (Default = 5 seconds)
The refresh interval specifies how often the database performance statistics are collected. It can be set to seconds, minutes, hours, or days. Since most of the statistics for Adaptive Server are cumulative counters stored in the columns of monitoring tables, the Performance Monitor keeps track of those statistics changes and presents the delta values for each time interval in the line charts, bar charts, and pie charts. This makes it easy to pinpoint the resource consumption peak time by reviewing those graphical presentations.
For example, you can check for database performance by taking snapshots of the database statistics for each 15 minutes by setting a Refresh Interval at 15 minutes with Preserve Data number of intervals set at 200. The Performance Monitor starts monitoring the database statistics until you manually stop monitoring. The Performance Monitor keeps up to 200 *15 minutes = 3000 minutes (50 hours) of statistics data in memory for review. If the monitoring time is longer than the reserve interval data time, the most current 50 hours of data is retained.
Schedule (Default = cleared)
The Schedule monitor function starts the monitor at a specified Start Time enabling the tracking of the performance of the database at a specific time. The scheduled monitoring uses the Refresh Interval setting to collect the statistics at regular intervals. The monitoring stops once the End Time is reached.
Preserve Data
When monitoring, the statistics are stored in memory for each Refresh Interval. All the statistics for each interval are kept in memory to facilitate the graphical plotting and data retrieval.
Number of intervals (Default = 200)
Specify the number of Refresh Intervals that are stored by the monitoring process for your review.
Duration time (Not including processing time) (Default = 1000 s)
This is a calculation presented in seconds using this formula: Number of intervals * Refresh Interval
Chart Data Normalization Factor (CNF)
Since the Refresh Interval time is adjustable by users for each monitor task, the statistical data is proportional to the selected Refresh Interval time. For example; a 10 minutes Refresh Interval may collect 100 writes on Master device, but 30 minutes refresh interval may have 300 writes on Master device. It would be easy to be misled by just looking at the result of 300 writes to judge them in comparison to the 100 writes. The Performance Monitor provides a normalization factor to help standardize the result statistics scale. The following is an example of using 5 minutes as a normalization factor to calculate the results for different Refresh Interval settings:
| Monitor Time |
Refresh Interval (RI) |
Master Device Writes (MDW) |
CNF |
CNF Result = RI / MDW * CNF |
|
09:00AM-11:00AM |
10 minutes |
100 writes |
5 minutes |
50 writes |
|
01:00PM-03:00PM |
30 minutes |
360 writes |
5 minutes |
60 writes |
|
04:00PM-06:00PM |
60 minutes |
540 writes |
5 minutes |
45 writes |
With the Chart Data Normalization Factor, the result is standardized to 5 minutes and the comparison is more accurate. This example shows that the Monitor Time from 1:00PM to 3:00PM was more Write intensive on the Master device with 60 writes for every 5 minutes than the other time slices.
One second
Specify to use 1 second as the Chart Data Normalization Factor. This means that the statistics are shown as an average per second calculation. For example, using an Refresh Interval of 1 minute with 240 reads, the CNF for Reads is 240/60seconds = 4 Reads/per second.
Refresh Interval (Default)
Specify to use the Refresh Interval as the Chart Data Normalization Factor.
User Defined
Specify in seconds the Chart Data Normalization Factor.
The range of this setting is dependent upon the Refresh Interval measurement you select. The measurement is always in seconds.
Range for seconds: 1 - 60 (1 minute)
Range for minutes: 1 - 3600 (1 hour)
Range for hours: 1 - 216000 (60 hours)
Range for days: 1 - 4665600 (54 days)
Chart Data Normalization Factor text field
If the User Defined option is not selected, this seconds text field is dimmed and the calculation from the One second or Refresh Interval displays in this field.
Show confirmation before closing application (Default = checked)
Brings up a dialog field to confirm that you really want to exit the Performance Monitor.

 View Performance Monitor - General page