Converse agora com nosso suporte
Chat com o suporte

Foglight for Sybase 6.1.0.10 - User and Reference Guide

Using Foglight for Sybase
Exploring the Sybase Dashboards About the Sybase_MDA Agent About the Sybase_RS Agent Generating SybaseMDA Reports
Reference

Buffer Pools Dashboard

The Buffer Pools dashboard provides performance details for cache operations. This dashboard contains the following:

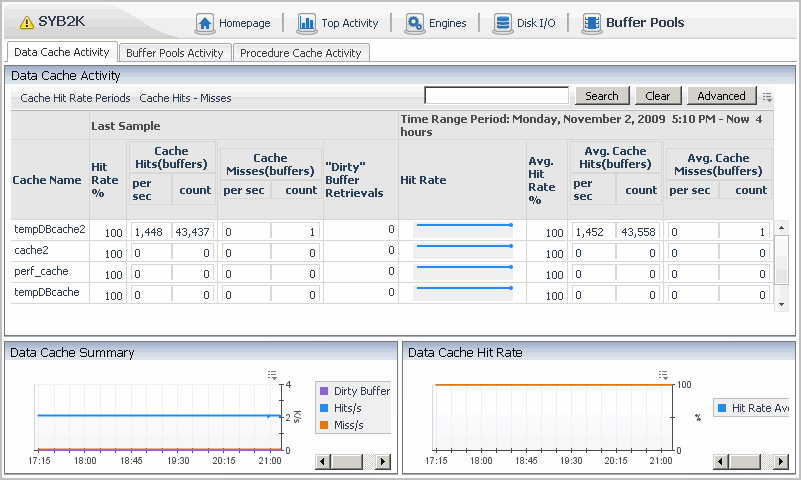
Data Cache Activity Tab

Data Cache can be divided to Buffer Pools with different I/O sizes.

The cache objects shown in this table are determined by the values set for the following Sybase_MDA agent properties:

For more information, see Setting Data Retrieval Properties .

Data cache information is provided in a table and charts:

This table includes two Data Cache Activity Buttons, which provide a simple way to find peaks times.

Cache Hit Rate Periods

A popup table lists:

Cache Hits - Misses

A popup table lists:

You can drill down by clicking any table field. A popup appears providing further drill downs to:

Cache Detail Graph— Sybase Data Each Detail Graph popup appears showing Hit Rate Average (in percent) and Hit Rate Minimum (in percent) plotted over time.

Cache Name

The name of the cache.

Last Sample

Hit Rate %

The percentage of times a requested procedure was found and therefore not read into the named cache.

Cache Hits (buffers) per sec

The number of times per second a requested page was found and therefore not read into the named cache.

Cache Hits (buffers) count

The number of buffers retrieved (that is, the number of Logical Reads) from the cache.

Cache Misses (buffers) per sec

The number of times per second a requested page had to be read into the named cache because it was not found.

Cache Misses (buffers) count

The number of buffers read (that is, the number of Physical Reads) into the cache from disk.

“Dirty” Buffer Retrievals

The number of dirty buffer retrievals.

Time Range Period:

Hit Rate

The number of times per second a requested page was found and therefore not read into the named cache for the selected time range.

You can drill down by clicking on any field in this column. A popup appears showing the following three values, plotted over time:

Avg. Hit Rate %

The average percentage of times a requested page was found and therefore not read into the named cache for the selected time range.

Avg. Cache Hits (buffers) per sec

The average number of cache hits per second for the selected time range.

Avg. Cache Hits (buffers) count

The average number of cache hits for the selected time range.

Avg. Cache Misses (buffers) per sec

The average number of cache misses per second for the selected time range.

Avg. Cache Misses (buffers) count

The average number of cache misses for the selected time range.

Cache Name

The name of the cache.

Name

The name of the data cache object.

Index ID

The identifier of the index. If this value is:

DB Name

The database name.

Cached (MB)

The amount of cached memory in megabytes.

Total Size (MB)

The total size of the cached object in the database in megabytes.

Percent Cached

The percentage of the total object's size that is cached memory.

Process Accessing

The number of processes currently accessing the object.

Data Cache Summary

The following three values are the total for all of the monitored caches, plotted over time:

Data Cache Hit Rate

The following two values for the monitored caches, plotted over time:

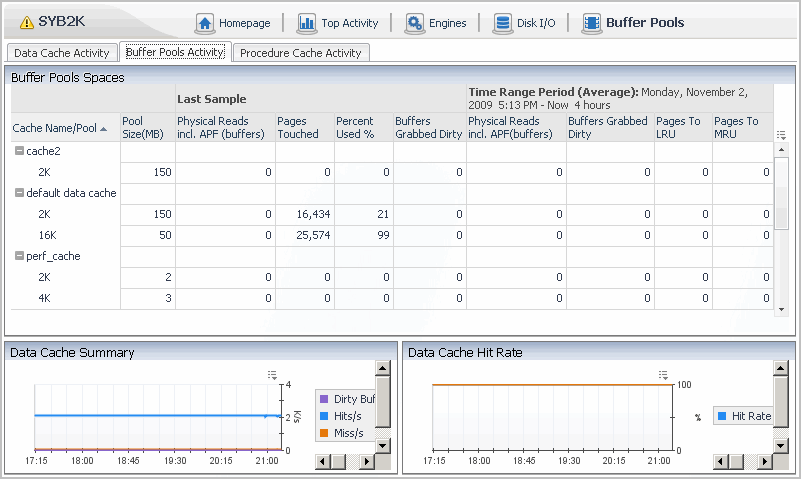
Buffer Pools Activity Tab

Buffer pools information is provided in a table and charts:

Cache Name/Pool

The name of the cache being monitored.

Pool Size (MB)

The number of megabytes that have been allocated for the pool.

Last Sample

Physical Reads incl. APF (buffers)

The number of buffers, including APF (Asynchronous Prefetch Activity) that have been read from disk into the pool.

Physical Reads (Pages)

The number of buffer pages that have been read from disk into the pool.

Pages Touched

The number of pages that are currently being used within the pool.

Percent Used (%)

Data space used as a percentage of total data space available.

Buffers Grabbed Dirty

The number of dirty buffer retrievals.

Time Range Period (Average)

Physical Reads incl. APF (buffers)

The number of buffers, including APF (Asynchronous Prefetch Activity) that have been read from disk into the pool for this time period.

Buffers Grabbed Dirty

The number of dirty buffer retrievals for this time period.

Pages to LRU

The number of buffers that were fetched and replaced in the least recently used portion of the pool.

Pages to MRU

The number of buffers that were fetched and replaced in the most recently used portion of the pool.

Data Cache Summary

The following three values, plotted over time:

Data Cache Hit Rate

The Hit Rate Average plotted over time:

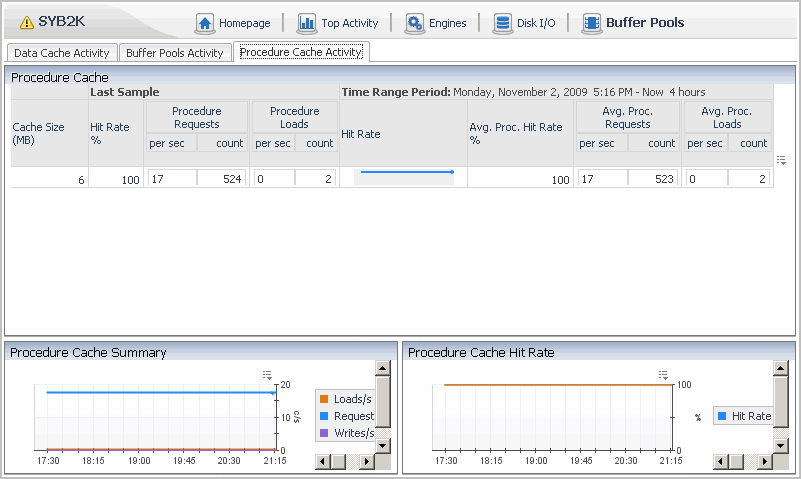
Procedure Cache Activity Tab

Procedure cache activity information is provided in a table and charts:

Cache Size (MB)

The size of the cache in megabytes.

Last Sample

Hit Rate %

The percentage of times a requested page was found and therefore not read into the named cache.

Procedure Requests per sec

The number of procedure requests per second resulting in reads from disk.

Procedure Requests count

The number of procedure requests resulting in reads from disk.

Procedure Loads per sec

The number of procedures per second loaded into cache.

Procedure Loads count

The number of procedures loaded into cache.

Time Range Period:

Hit Rate

The number of times per second a requested page was found and therefore not read into the named cache for the selected time range.

You can drill down by clicking on any field in this column. A popup appears showing the following three values, plotted over time:

Avg. Proc. Hit Rate %

The average percentage of procedure requests resulting in reads from disk.

Avg. Proc. Requests per sec

The average number of procedure requests per second resulting in reads from disk.

Avg. Proc. Requests count

The average number of procedure requests resulting in reads from disk.

Avg. Proc. Loads per sec

The average number of procedures per second loaded into cache.

Avg. Proc. Loads count

The average number of procedures loaded into cache.

Procedure Cache Summary

The following three values are the total for all of the monitored procedure caches, plotted over time:

Procedure Cache Hit Rate

The Hit Rate Average plotted over time.

Documentos relacionados

The document was helpful.

Selecione a classificação

I easily found the information I needed.

Selecione a classificação