Converse agora com nosso suporte
Chat com o suporte

Foglight for VMware 5.8.2 - User and Reference Guide

Using Foglight for VMware
Introducing the virtual infrastructure Navigation basics Interacting with Foglight for VMware VMware Performance Agent configuration
Reference
Views
VMware Alarms views VMware Explorer views VMware Modeler views VMware VirtualCenter views VMware Environment views Other views
Rules
Agent Rules Cluster Rules Datacenter Rules Datastore Rules Resource Pool Rules ESX Server Rules VirtualCenter Rules Virtual Machine Rules VMW Stale Data Management Rule Virtual Switch Rules
Appendix: Alarm Messages Appendix: Metrics

Generating reports

Generating reports

Foglight for VMware includes a report generation ability. This allows you to create reports using a set of predefined templates to report on the various aspects of your virtual environment. Foglight for VMware includes a collection of predefined report templates.

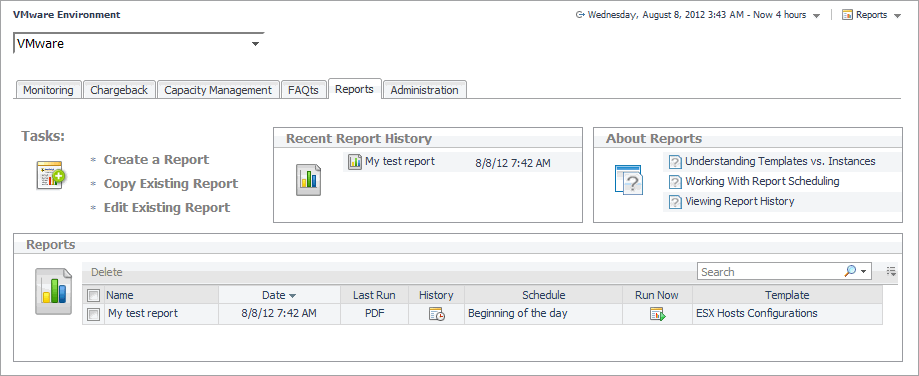
You can generate, copy, and edit reports using the Reports tab on the VMware Environment dashboard, or alternatively the Reports dashboard included with the Management Server.

Figure 58. Reports tab

For complete information about this tab, see the Managing Capacity in Virtual Environments User Guide. For more information about the Reports dashboard, see the Foglight User Help.

You can generate, copy, and edit reports using the Reports dashboard included with the Management Server. For more information, see the Foglight User Help.

The following templates are available with Foglight for VMware.

ESX Host

Shows the capacity of one or more datastores.

ESX Host

Shows, for a specified datastore, its usage per-ESX Host.

ESX Host

Contains the capacity and performance details for the selected ESX Host.

ESX Host

Summarizes the capacity and performance details of the selected ESX Host.

VirtualCenter

Shows the configurations for the ESX Hosts in the selected vCenter.

Service

Contains the network performance details for the ESX Hosts in the selected service.

Service

Contains the performance details for the ESX Hosts in the selected service.

Service

Summarizes the performance details of the ESX Hosts in the selected service.

Service

Shows the top 5 and bottom 5 ESX Hosts for queue and total disk latency over a user-specified time range. The report takes into consideration only the ESX Hosts in the service specified.

Datacenter

Contains the summary details for the ESX Servers contained within the selected datacenter.

Service

Contains the summary details for the ESX Hosts contained within the selected service.

VirtualCenter

Contains the summary details for the ESX Servers managed by the selected vCenter.

Service

Shows the top N and bottom N ESX Hosts based on CPU utilization, CPU percent ready, memory utilization, disk transfer rate, and network transfer rate over a user-specified time range. The value of N is also user-specified. The report takes into consideration only the ESX Hosts in the service specified.

Service

Shows the top 5 and bottom 5 ESX Hosts based on CPU utilization, CPU percent ready, memory utilization, disk transfer rate, and network transfer rate over a user-specified time range. The report takes into consideration only the ESX Hosts in the service specified.

Cluster

Contains the capacity details for the ESX Servers contained within the selected cluster.

Datacenter

Contains the capacity details for the ESX Servers contained within the selected datacenter.

Service

Contains the capacity details for the ESX Servers in the selected service.

VirtualCenter

Contains the capacity details for the ESX Servers managed by the selected vCenter.

Service

For all of the open snapshots for each virtual machine in the specified service. Open snapshots are those with no child snapshots.

VirtualCenter

Lists the powered off virtual machines in a specified vCenter.

Service

For all of the snapshots older than N days for each virtual machine in the specified service. The value of N is user-specified with a default value of 100. All snapshots are included in the report.

Service

Shows the virtual machine host changes for a given service.

VirtualCenter

This template can be used to generate a report that contains the alarm (or event) history for the selected vCenter object.

Datastore

Shows the capacity of the selected datastores and lists the ESX Servers and virtual machines that are connected to them. Information about the logical and physical disks on the virtual machines is also displayed in this report.

N/A

Summarizes your virtual infrastructure, so that you can be sure you are in compliance with the Foglight for VMware license.

Service

Shows, for a given service, the CPU usage for virtual machines and the percent of time those virtual machines were waiting on CPU cycles.

ESX Server

Shows, for a given set of ESX Servers, or for all ESX Servers if none are specified, the CPU usage for virtual machines and the percentage of time those virtual machines were waiting on CPU cycles.

Virtual Machine

Lists virtual machines along with the status of their VMware Tools installation.

Service

Shows the top N and bottom N virtual machines based on available CPU and memory over a user-specified time range. The value of N is also user-specified. The report takes into consideration only the virtual machines in the service specified.

Service

Shows the top 5 and bottom 5 virtual machines based on available CPU and memory over a user-specified time range. The report takes into consideration only the virtual machines in the service specified.

VirtualCenter

Shows the configurations for the virtual machines in the selected vCenter.

Virtual Infrastructure

Shows the number of virtual machines configured and the number of virtual machines powered on during a user-specified time range. The report displays the data in separate tables based on clusters and standalone ESX hosts. In addition, the report provides this information on a per-cluster and per-server basis. The report takes into consideration the clusters and standalone ESX hosts of the whole virtual infrastructure; it is not based on a specific service.

Virtual Infrastructure

Shows the number of virtual machines configured and the number of virtual machines powered on during a user-specified time range. The report displays the data in separate tables based on clusters and standalone ESX hosts. The report takes into consideration the clusters and standalone ESX hosts of the whole virtual infrastructure; it is not based on a specific service.

VirtualCenter

Shows relevant details for all virtual machines that have X percent or less free storage available. The value of X is user-specified.

VirtualCenter

Summarizes relevant details for all virtual machines that have X percent or less free storage available. The value of X is user-specified.

VirtualCenter

Shows relevant details for all virtual machines that have X percent or more free storage available. The value of X is user-specified.

VirtualCenter

Summarizes relevant details for all virtual machines that have X percent or more free storage available. The value of X is user-specified.

Service

Contains the network performance details for the virtual machines in the selected service.

Virtual Machine

Shows the capacity and usage of logical and physical disks on the selected virtual machines.

Service

Shows the top N and bottom N virtual machines based on CPU-used Hz, CPU percent ready, memory consumed, disk growth rate, disk transfer rate, and network transfer rate over a user-specified time range. The value of N is also user-specified. The report takes into consideration only the virtual machines in the service specified.

Service

Shows the top 5 and bottom 5 virtual machines based on CPU-used Hz, CPU percent ready, memory consumed, disk growth rate, disk transfer rate, and network transfer rate over a user-specified time range. The report takes into consideration only the virtual machines in the service specified.

VirtualCenter

Shows relevant details for all virtual machines that have X percent or less overallocated memory. The value of X is user-specified.

VirtualCenter

Shows relevant details for all virtual machines that have X percent or more overallocated memory. The value of X is user-specified.

Service

Shows the status of the VMware tools for the existing virtual machines and suggests required actions. The report takes into consideration only the virtual machines associated with the selected service.

VMware Performance Agent configuration

The VMware Performance Agent collects data from the virtual infrastructure and sends it to the <Product Name>™ Management Server. The agent keeps track of resource utilization metrics and alerts you when certain pre-defined thresholds are reached.

VMware Performance Agent and Agent Manager configuration

On 64-bit hosts meeting the minimum system requirements, the embedded Agent Manager can be used to run VMware Performance Agents to monitor up to 500 virtual machines. If the total number of virtual machines to be monitored from a single agent host is greater than 500, an Agent Manager should be installed on a separate host.

If additional cartridges and agents are added to the environment, product performance should be monitored and agents moved off of the embedded Agent Manager to reduce the load.

21

4 GB

2000

21

4 GB

2000

1 Additional CPUs may be required for larger environments.

Monitoring more than 4000 virtual machines from a single agent host

The Agent Manager JVM usually requires additional memory to monitor more than 4000 virtual machines. The total number of virtual machines is the total from all vCenters that will be monitored from all VMware Performance agents running on the Agent Manager.

The following calculations are guidelines, not hard and fast rules. Memory requirements can vary greatly from installation to installation with similar VM counts. If insufficient memory is configured, the failure mode is easily recognizable: all agents on the Agent Manager host will go into a broken state after the agent(s) were activated for a short period of time, usually within 24 hours. In addition, the Agent Manager log will contain a line similar to the following:

If this is the case, add memory greater than what is shown in the calculations below, in increments of 512 MB until the agents stabilize.

JVM memory requirements for VMware Performance agents are calculated using the following formula:

According to the above formula, monitoring 4000 virtual machines requires 2560 MB of memory:

This is the default setting for agents deployed on 64-bit systems.

Similarly, monitoring 8000 virtual machines requires 4608 MB of memory:

This requires a change in the default Agent Manager settings.

1
Determine the amount of additional memory required. This will be the total from the last step above minus the default value of 2560 MB. In the example above, this is 4608 MB – 2560 MB = 2048 MB.
2
On the agent machine, open the baseline.jvmargs.config file for editing. The file is located in the <Agent_Manager_home>/state/default/config directory.
3
Add the following lines to the memory settings section:
Documentos relacionados

The document was helpful.

Selecione a classificação

I easily found the information I needed.

Selecione a classificação