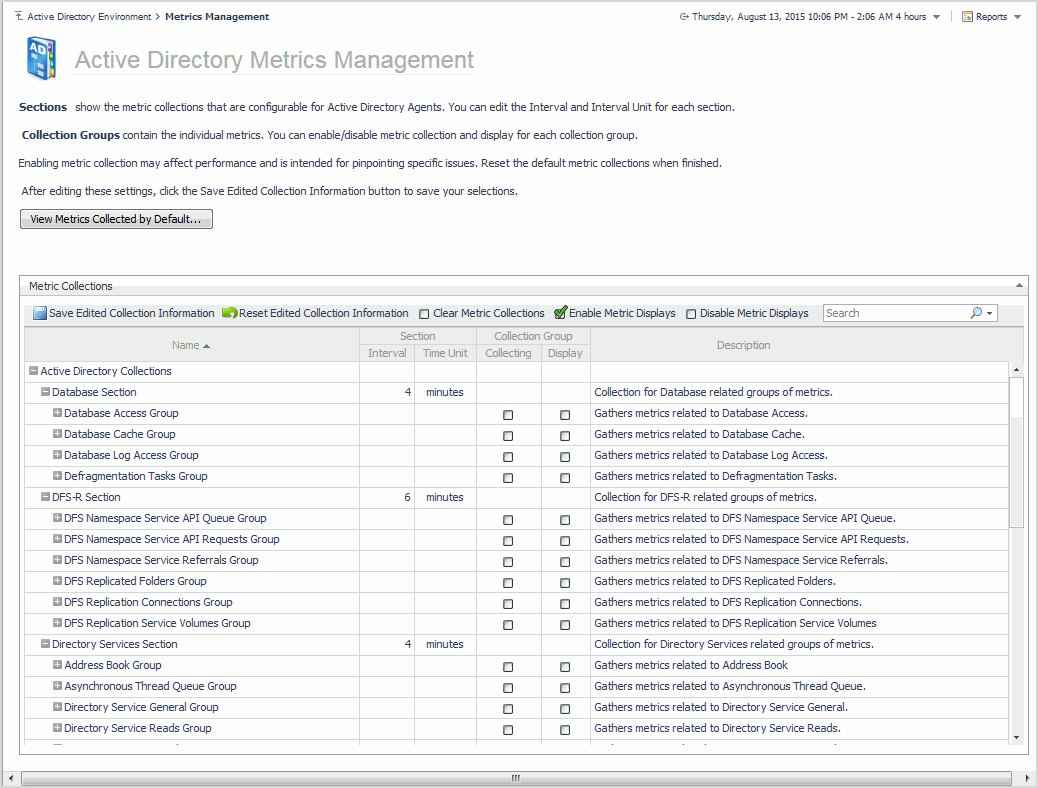
Active Directory Metrics Management dashboard
|
Indicates whether the metrics in the collection group are to be collected and/or displayed. | |
|
Displays a brief description of each section, collection group, and individual metric. |
Use the buttons on this dashboard as described in the following table.
Managing Active Directory metrics
For details, see these topics:
Using the Metrics Management dashboard
To display this dashboard, select Active Directory Environment > Administration tab > Metrics Management from the dashboards listed in the navigation pane.
|
2 |
To change the interval, select the value displayed in the Interval column. Enter the new value in the dialog and select Update. |
|
3 |
To change the time unit, select the value displayed in the Time Unit column. Select the new time unit (days, hours or minutes) in the dialog and select Update. |
|
4 |
Select the Save Edited Collection Information toolbar button to save your selections. |
|
2 |
Click the check box in the corresponding Collection Group | Collecting cell. |
|
4 |
Click the check box in the corresponding Collection Group | Display column. |
|
6 |
Select the Save Edited Collection Information toolbar button to save your selections. |
|
7 |
On the Save dialog, click Save to confirm that you want to save your selection. |
|
2 |
Click the enabled check box (contains a green check mark) in the corresponding Collection Group column (Collecting or Display). |
|
4 |
Select the Save Edited Collection Information toolbar button to save your selections. |
|
5 |
On the Save dialog, click Save to confirm that you want disable the selected metric collection. |
|
1 |
From the Active Directory Metrics Management page, select the View Metrics Collected by Default button. |
Using the Agent Status and Agent Properties dashboards
To display an agent’s properties page, use one of the following methods:
|
• |
From the navigation panel, navigate to Dashboards > Administration > Agents > Agent Status. On the Agent Status dashboard, select an agent from the list and click Edit Properties. The Agent Status dashboard refreshes, showing the current properties for the selected agent instance. |
|
• |
From the navigation panel, navigate to Dashboards > Administration > Agents > Agent Properties. On the Agent Properties dashboard, select an agent. The Properties panel is displayed, showing the current properties for the selected agent instance. |
|
2 |
|
• |
After editing the collection interval, select Save Changes. |
|
3 |
Back on the Agent Status/Agent Properties dashboard, select Save to save your selections. |
For more information on using these dashboards to edit an agent’s properties, see the Foglight Administration and Configuration Guide or online help.

