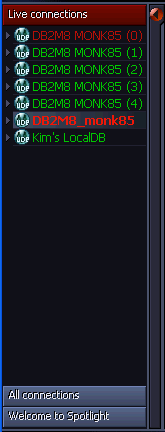
Spotlight browser panel
The Spotlight browser lists the active DB2 for LUW (Linux, Unix, and Windows) databases and database partitions that you are monitoring in this session. From the Spotlight browser, you select a specific database or partition to view the home page or drilldown showing performance information specific to the selected system. You can also use the Spotlight browser to disconnect from a specific database or a partition.
Here are certain points you need to know about the browser list:
-
This list shows the user-defined connection name for each database and for each database partition for which you created a connection profile and to which Spotlight is currently connected.
-
If the connection profile for a partitioned database was defined with the DB2 Auto Monitor Nodes option selected, every partition (node) for the database is automatically listed in the browser when you open this connection in Spotlight. Each partition is labeled as DB2_instance_name DB2_database name (partition number). If you select one these partitions from the browser, the home page or drilldown refreshes, showing performance information specific to that database partition only. If you select the database (listed with the connection name defined in the profile) from the browser, the home page and drilldowns show aggregate performance information across all the partitions for the database.
-
If the connection profile for a partitioned database was defined with Global selected in the DB2 Node field, a single connection for the database is listed in the browser when you open this connection in Spotlight. When you select this database from the browser, the home page and drilldowns for this database reflect aggregate performance information across all the partitions (partitions) for the database.
-
If the connection profile was defined with a specific partition (node) number selected in the DB2 Node field, only that partition for the database is listed in the browser when you open the connection. When you select this partition from the browser, the home page and drilldowns show performance information specific to this database partition only.
-
The color of the database or partition name reflects the highest severity being experienced by that system.
-
The highlighted name specifies the database or partition that you are monitoring on the current home page or drilldown.
The following shows an example Spotlight browser:

For a complete description of functionality of the Spotlight browser, refer to the link in the Related topics section below.
For browser information specific to Spotlight on IBM® DB2® LUW, refer to the links in the Procedures section below.
Procedures
Switching between database, partition, and instance home pages
