지금 지원 담당자와 채팅
지원 담당자와 채팅

Foglight for VMware 5.8 - User and Reference Guide

Using Foglight for VMware
Introducing the virtual infrastructure Navigation basics Interacting with Foglight for VMware VMware Performance Agent configuration
Reference
Views
VMware Alarms views VMware Explorer views VMware Modeler views VMware VirtualCenter views VMware Environment views Other views
Rules
Agent Rules Cluster Rules Datacenter Rules Datastore Rules Resource Pool Rules ESX Server Rules VirtualCenter Rules Virtual Machine Rules VMW Stale Data Management Rule Virtual Switch Rules
Appendix: Alarm Messages Appendix: Metrics

Topology views

A typical VMware environment consists of many interrelated components. Understanding the dependencies between specific components in your monitored environment and the levels of resources they consume allows you to better understand resource-related issues, potentially affecting the stability of your system. This can help you predict the impact a potential outage may have on your environment, and to prevent such events, by reallocating resources where they are most needed.

The VMware Environment dashboard includes several topology views that visualize the relationships between the objects in your environment through an interactive dependency map. The map illustrates how different components relate to each other, and the levels of the available resources available to them.

Figure 127. Topology view

The complexity of the information appearing in a dependency map depends on the selected object and the dependencies that object has with other objects within your integrated infrastructure.

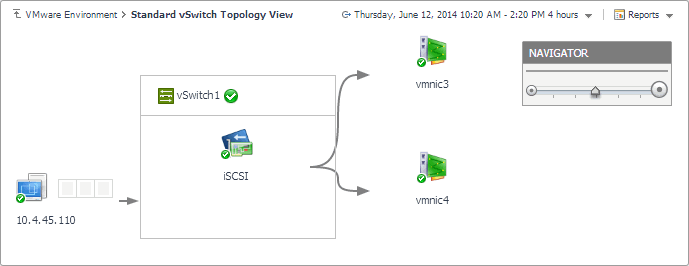
In a large multi-component environment, dependency maps are likely complex and may not fit your screen. The NAVIGATOR in the top-right corner allows you to easily set the zoom level by dragging the slider into the appropriate position.

Figure 128. Navigator view

In a dependency map, some objects are represented with container tiles, others with single-object tiles or just icons. Every object in the map includes an indicator of its health.

Dependencies between the objects in a map are illustrated with single-directional arrows. The color of the arrow reflects the alarm state of the target object: gray for Normal, yellow for Warning, orange for Critical, and red for the Fatal state.

To find out more about an object appearing in the dependency map, click the object icon. A dwell appears, displaying more details about that object. The type and range of information appearing in the dialog box depends on the selected object’s type. For example, drilling down on a virtual switch shows the switch name, alarm counts top virtual machine consumers, levels of traffic utilization, percentage of packet loss, current traffic types, available bandwidth, the numbers of available and all ports, and the number of active versus standby NICs.

Figure 131. Drilldown view

Virtual Switches view

This view is a tree view. It lists the virtual switches that exist in your environment and shows their state.

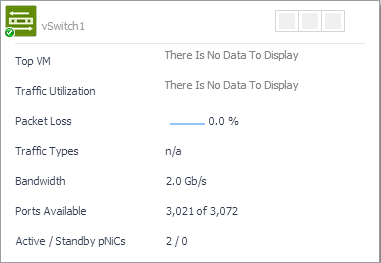
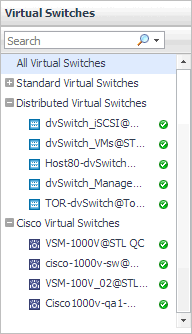
Selecting the All Virtual Switches node displays overall performance statistics for all virtual switches in your integrated system, and identifies the elements that consume the highest amount of system resources in the Summary - All Virtual Switches view on the right. Similarly, selecting a virtual switch node shows Virtual Machine-specific metrics in the Summary - Standard Virtual Switch view, Summary - Distributed Virtual Switch view, or Summary - Cisco Virtual Switch view on the right. The type of the displayed view reflects the type of the selected virtual switch (standard, distributed, or Cisco).

On the VMware Environment dashboard, on the Monitoring tab, in the Quick-View, select the Virtual Switches tile.
The Virtual Switches view appears in the Quick-View on the left.
Alarm severity. The state of the most recent alarm raised against the associated virtual switch.
All Virtual Switches. A parent node for the virtual switch object instances that appear in this view.
Virtual Switches. The virtual machine name.

Drill down on:

Other views

Other views include:

Action panel

The action panel provides you with easy access to a number of useful actions and tasks. However, it only provides additional Foglight for VMware related actions when you are viewing the VMware Explorer dashboard.

The actions available in the action panel vary depending on the object displayed in the VMware Explorer dashboard.

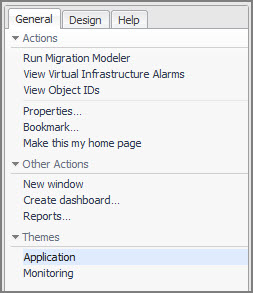
The following image shows an example of a typical VMware Explorer dashboard action panel.

Figure 133. Action panel

Under Actions, the action panel may provide the following related actions:

For more information about the action panel with respect to Foglight for VMware and the associated actions, see Accessing VMware actions and tasks .

The action panel is located at the far right of the Foglight for VMware browser interface.

관련 문서

The document was helpful.

평가 결과 선택

I easily found the information I needed.

평가 결과 선택