Network tab
This tab displays the utilization of the virtual switches associated with the selected ESX hosts.
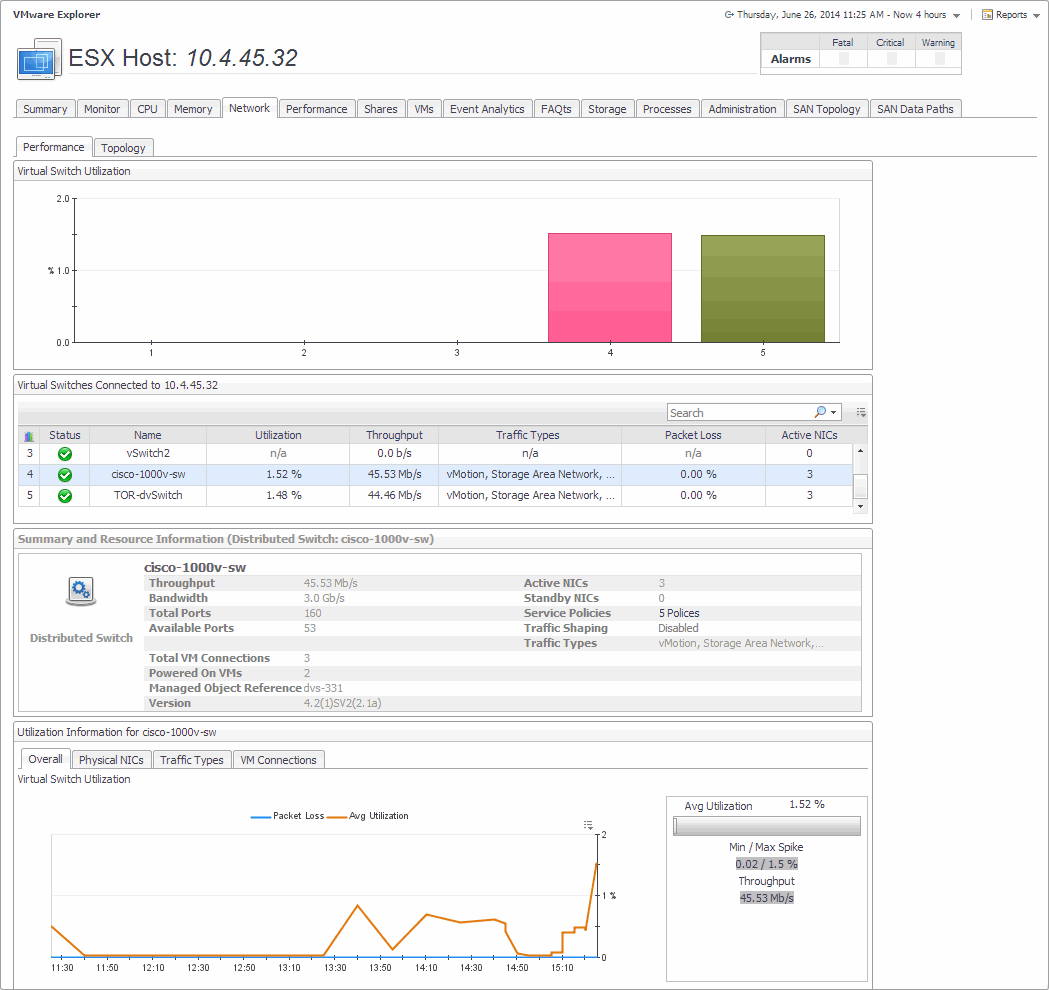
This tab is made up of the following embedded views:
|
|
Shows detailed configuration information about the selected virtual switch. |
|
|
|
• |
Throughput. The rate of network traffic processed by the virtual switch. | |
|
|
|
• |
Bandwidth. The amount of network bandwidth available to the switch. | |
|
|
|
• |
Total Ports. The total number of ports on the virtual switch. | |
|
|
|
|
|
|
• |
Total VM Connections. The total number of virtual machines connected to the ESX host through the virtual switch. | |
|
|
|
• |
Powered On VMs. The total number of virtual machines connected to the ESX host through the virtual switch that are currently powered on. | |
|
|
|
|
|
|
• |
Version. The version number of the distributed switch component in your virtual environment. | |
|
|
|
• |
Active NICs. The number of active network interface cards that the virtual switch uses. | |
|
|
|
• |
Standby NICs. The number of network interface cards that the virtual switch uses, that are currently in standby mode. | |
|
|
|
• |
Network I/O Control (standard or distributed virtual switches only). Indicates if the selected switch can use network resource pools to prioritize network traffic. | |
|
|
|
• |
Service Policies (Cisco virtual switches only). Shows the number of service policies in use. | |
|
|
|
• |
Traffic Shaping. Indicates if the traffic shaping policy is enabled or disabled on the selected switch. A traffic shaping policy can restrict the network bandwidth to a port or if a port is configured to temporarily allow transmission of data at higher than normal speeds. For more information about these policies, see your VMware documentation. | |
|
|
|
• |
Traffic Types. Identifies the data traffic types that are processed by the virtual switch. | |
|
|
Drill down on: |
|
|
|
|
|
|
• |
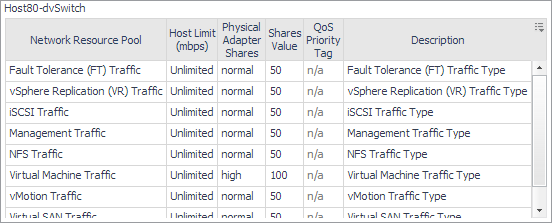
Traffic Shaping. Displays a dwell showing a list of port groups associated with the virtual switch and the related information. |

|
|
|
|
• |
Service Policies (Cisco virtual switches only). Displays the Service Policies dialog box showing a navigation tree with port groups and the policies associated with each group. Navigate the tree and click a network policy to find out more information about it. |
|
|
|
Displays detailed utilization information for the virtual switch selected in the Performance tab, Virtual Switches Connected to ESX Host view. |
|
|
|
• |
Overall tab, Virtual Switch Utilization chart. Displays the overall switch efficiency. The Packet Loss line in the chart represents the average percentage of time the data packets sent to the monitored switch are not echoed back over the selected time period. The Avg Utilization line in the chart represents the average percentage of the network resources available to the switch that are in use over the selected time period. The Avg Utilization percentage indicates the average percentage of the network resources available to the switch that are currently in use. Min / Max Spikes shows the difference between the lowest and highest percentage of the average utilization. Throughput is the rate of network traffic processed by the virtual switch. | |
|
|
|
|
|
|
• |
Physical NICs tab, Physical Adapter Distribution chart. Displays the overall workload distribution for each network interface card used by the virtual switch. High/Low Utilization shows the difference between the lowest and highest percentage of the average utilization. Variance is the difference between the lowest and highest average network adapter utilization | |
|
|
|
• |
Traffic Types tab, Traffic Type Utilization chart. Illustrates how different types of data traffic are represented in the overall network traffic managed by the selected switch. The current percentages of different type of network traffic appear in the table, while the chart displays the values captured over the selected time period. | |
|
|
|
Performance tab
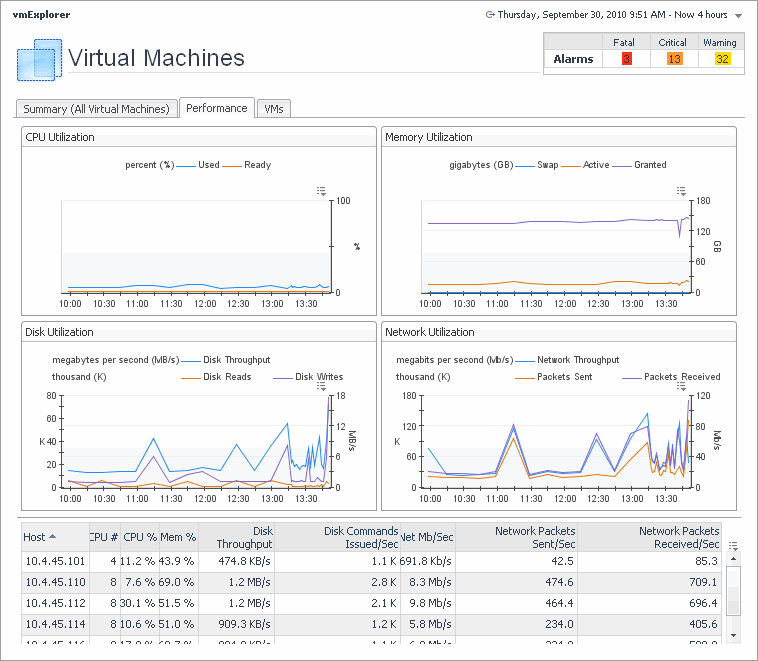
This tab displays the resource utilization for the selected object or group of objects over a selected period of time.
|
2 |
On the Virtual Infrastructure view, that appears on the navigation panel, select a Virtual Center, datacenter, cluster, ESX host, resource pool, or one of the following containers: Datacenters, ESX Hosts, Resource Pools, or Virtual Machines. |
This tab is made up of the following embedded views:
Processes tab
This tab only appears when you are exploring individual Virtual Centers, ESX hosts, and virtual machines, and have Foglight for Guest Processes Investigation installed and active. It displays an organized view of process information gathered by Foglight for Guest Process Investigation from the virtual or physical machine configured to send process information. When you open this tab, the process information for the selected server or virtual machine appears, allowing you to view the current CPU, memory, and monitored process statistics.
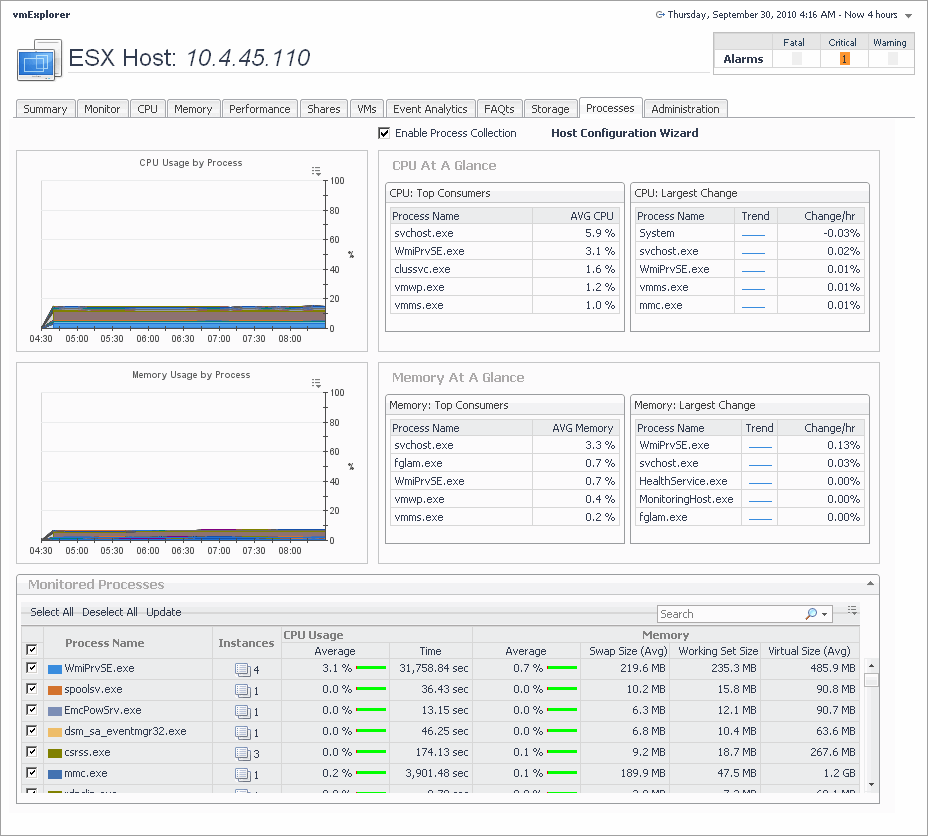
This tab is made up of several embedded views. For complete information about these views, see the Investigating Guest Processes User and Reference Guide.
Related Objects views
At least one Related Objects view is provided in the VMware Explorer dashboard.
Related Objects views are part of the VMware Explorer Primary view and are typically located at the bottom of the Primary view. More than one Related Objects view may appear at a time.
Related Objects views provide summary information on either the parent or child objects or both (whichever is applicable) of the object being viewed in the dashboard.
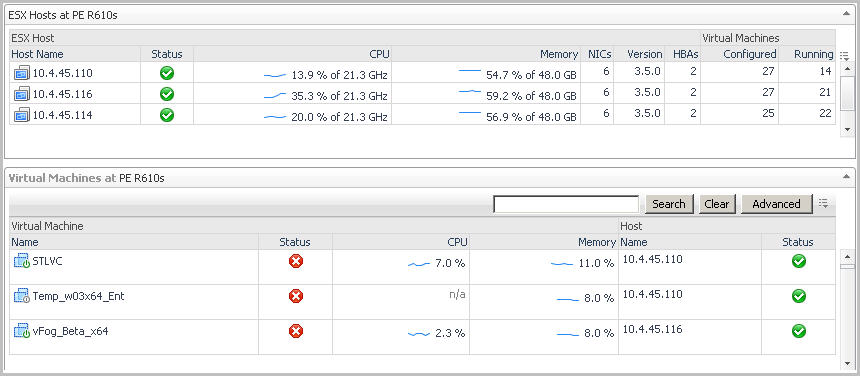
Related Objects views differ from each other and may not appear at all depending on the object or collection of objects selected from the Virtual Infrastructure view and on the navigation tab selected from the VMware Explorer Primary view heading.
Related Objects views for an individual object display tables that list either the parents or children or both (whichever is applicable) of the selected object, and provide pertinent summary details about each one. The Related Objects view for a collection of objects displays a table that lists all of the objects in the selected collection and provides pertinent summary details about each one. You can sort Related Objects view tables by a particular column by clicking the corresponding column heading. If you select an object from the table by clicking on one of the table rows, all of the views in the VMware Explorer dashboard get updated with information about that object.