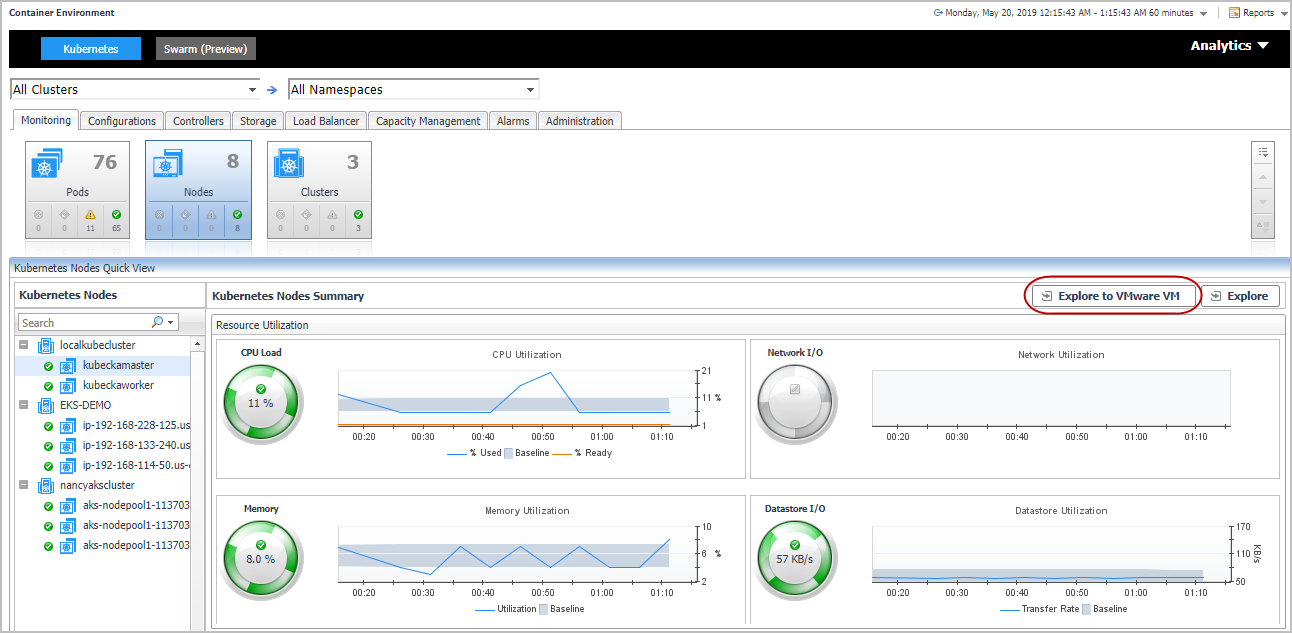
The Kubernetes Nodes Summary view appears on the right when you select a node in the Kubernetes Nodes tree view.
The Kubernetes Nodes Summary view displays the following data:
|
• |
Resource Entitlement: The resource allocation for the selected Kubernetes node over a selected period of time, which includes the following: |
|
• |
CPU Allocatable: Shows the current allocatable CPU resources of this node. |
|
• |
Memory Allocatable: Shows the current allocatable Memory resources of this node. |
|
• |
CPU Request: Shows the trend of CPU request, limit, and capacity of this node. |
|
• |
Memory Request: Shows the trend of Memory request, limit, and capacity of this node. |
|
• |
Resource Utilizations: The resource utilization for the selected Kubernetes node over a selected period of time, which includes the following: |
|
• |
CPU Utilization: Shows the CPU utilization summary for the selected Kubernetes node based on its total capacity during a selected time period. |
|
• |
Transfer Rate: Shows the network utilization summary for the selected Kubernetes node, including the average rate of network throughput, and the amounts of data sent to and received from the network. |
|
• |
Memory Utilization: Shows the physical memory utilization summary for the selected Kubernetes node, broken into the amounts of memory that is swapped to disk, actively used, and allocated, all during a selected time period. |
|
• |
File System Usage: Shows the file system resource utilization summary for the selected Kubernetes Pod, including the available/total/limited file system resource. |
|
• |
Summary: Displays the detailed information about the selected Kubernetes node, including Name, Pod CIDR, OS, Architecture, OS Image, Address, Capacity, Allocatable, and Status. |
Click Explore on the upper right of the Kubernetes Nodes Summary view to open the Nodes Explorer view, which shows more detailed information about this Kubernetes node.
|
NOTE: If the virtual machines belong to the Container cluster, and they are monitored by other cartridges at the same time, for example, VMware, Infrastructure, AWS, or Azure. Then, the collected data will come from that cartridge directly and the Kubernetes Nodes Summary view will be different from the screenshot above. See Figure 7 for detailed information. |
|
• |
Explore to VMware VM: Click the button to open the VMware Explorer view, which is the same view from VMware cartridge. The Explore to xx button varies from the cartridge that is monitoring the machines. Currently, the supported cartridges include: VMware, Infrastructure, AWS, and Azure. |
|
• |
Resource Utilizations: The displayed metrics will be slight different among different monitoring cartridges. |
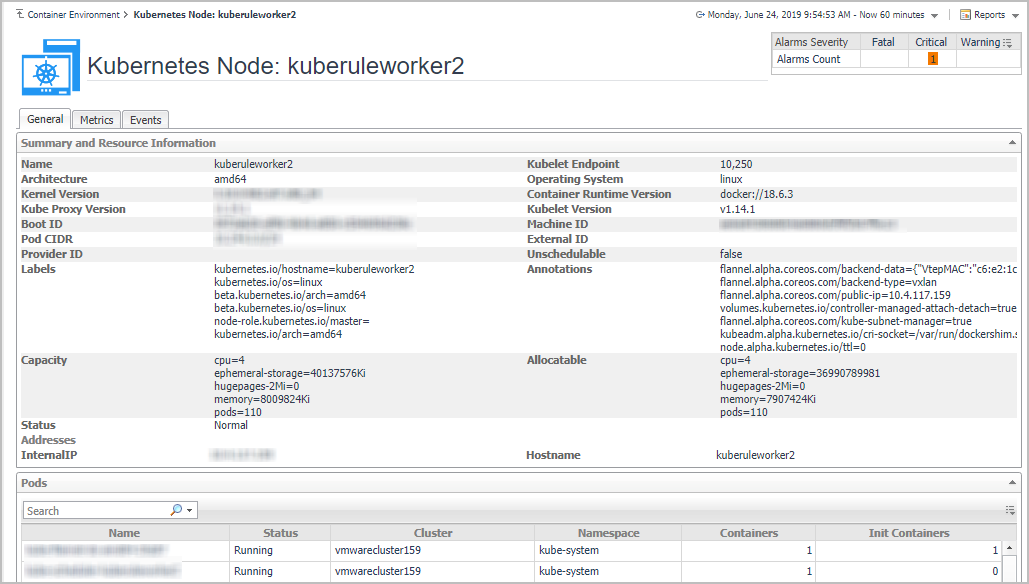
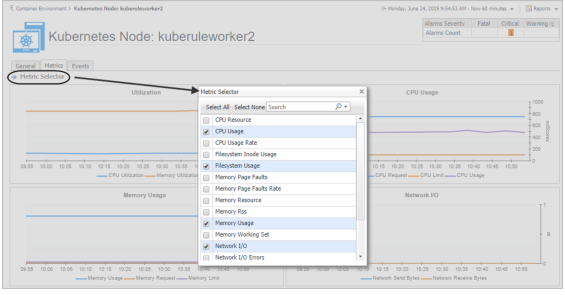
The Nodes Explorer view opens when you click Explore in the Kubernetes Nodes Summary view, which includes the following tabs:
|
• |
General tab: The General tab displays the overall information of the selected Kubernetes node over a selected period of time, including the Summary and Resource Information table and the Pods table. For more information, see Node metrics . |
|
• |
Metrics tab: The Metrics tab displays a Metric Selector allowing you to choose the metrics to be plotted on this dashboard. Charts of CPU Usage, Utilization, Memory Usage, and Network I/O are presented by default. |
|
• |
Event tab: The Event tab lists all the events occur on the nodes. |

Kubernetes cluster is a group of kubernetes resources. There are two kinds of nodes inside a cluster, Kubernetes master and Kubernetes nodes. Kubernetes master is responsible for maintaining the desired state of your cluster which Kubernetes node is responsible to run your application and cloud workflows.The Kubernetes Cluster Quick View, which appears after clicking Monitoring > Clusters, shows the data collected about the selected clusters and namespaces. This view consists of the following two panes:
|
• |
The Kubernetes Clusters tree view, which appears on the left of Kubernetes Clusters Quick View, lists the clusters existing in the monitored Kubernetes environment. |
|
• |
The Kubernetes Clusters Summary view, which appears on the right after you select an individual cluster in the Kubernetes Clusters tree view. |
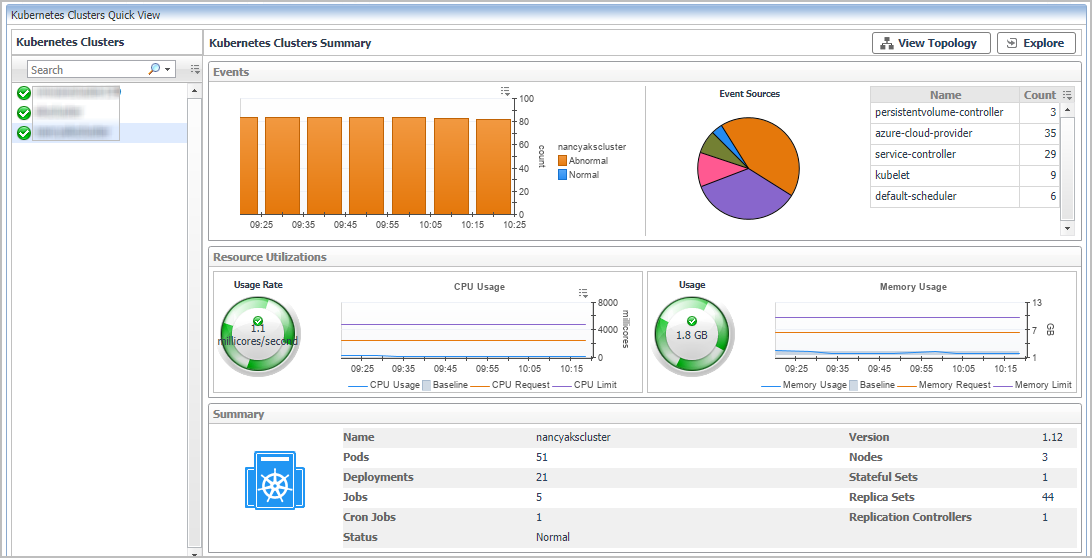
The Kubernetes Clusters Summary view appears on the right when you select a node in the Kubernetes Clusters tree view.
The Kubernetes Clusters Summary view displays the following data:
|
• |
Events: The events occur on the selected Kubernetes cluster over a selected period of time, which includes: |
|
• |
|
• |
Resource Utilizations: The resource utilization for the selected Kubernetes cluster over a selected period of time, which includes the following: |
|
• |
Usage Rate: Shows the CPU usage summary for the selected Kubernetes cluster based on its total capacity during a selected time period. |
|
• |
Memory Usage: Shows the physical memory utilization summary for the selected Kubernetes node, broken into the amounts of memory that is swapped to disk, actively used, and allocated, all during a selected time period. |
|
• |
Summary: Displays the detailed information about the selected Kubernetes cluster, including Name, Version, Pods, Nodes, Deployments, Stateful Sets, Jobs, and Replica Sets. |
Click Explore on the upper right of the Kubernetes Clusters Summary view to open the Cluster Explorer view, which shows more detailed information about this Kubernetes cluster.
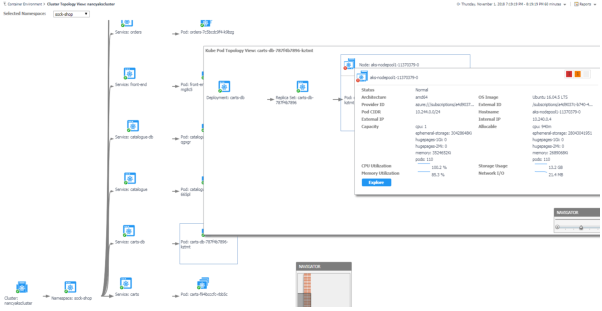
Click View Topology on the upper right of the Kubernetes Clusters Summary view to open the Cluster Topology view, which shows the topology graph from the application accessible aspect.
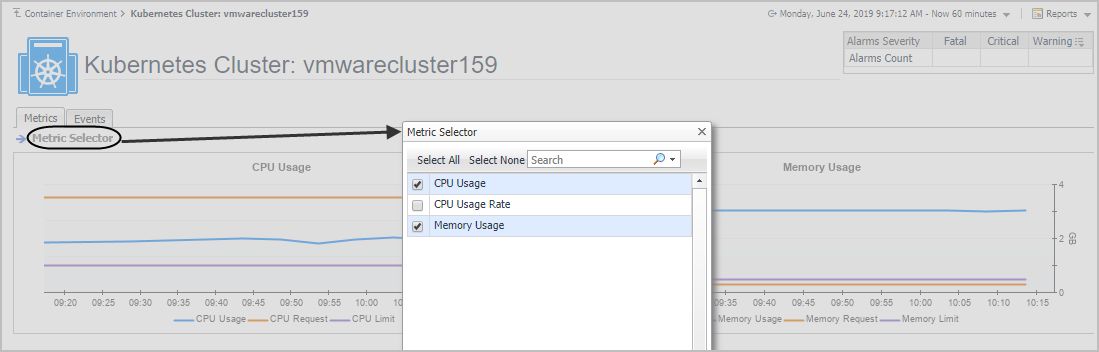
The Cluster Explorer view opens when you click Explore in the Kubernetes Clusters Summary view, which includes the following tabs:
|
• |
Metrics tab: The Metrics tab displays a Metric Selector allowing you to choose the metrics to be plotted on this dashboard. Charts of CPU Usage and Memory Usage are presented by default. |
|
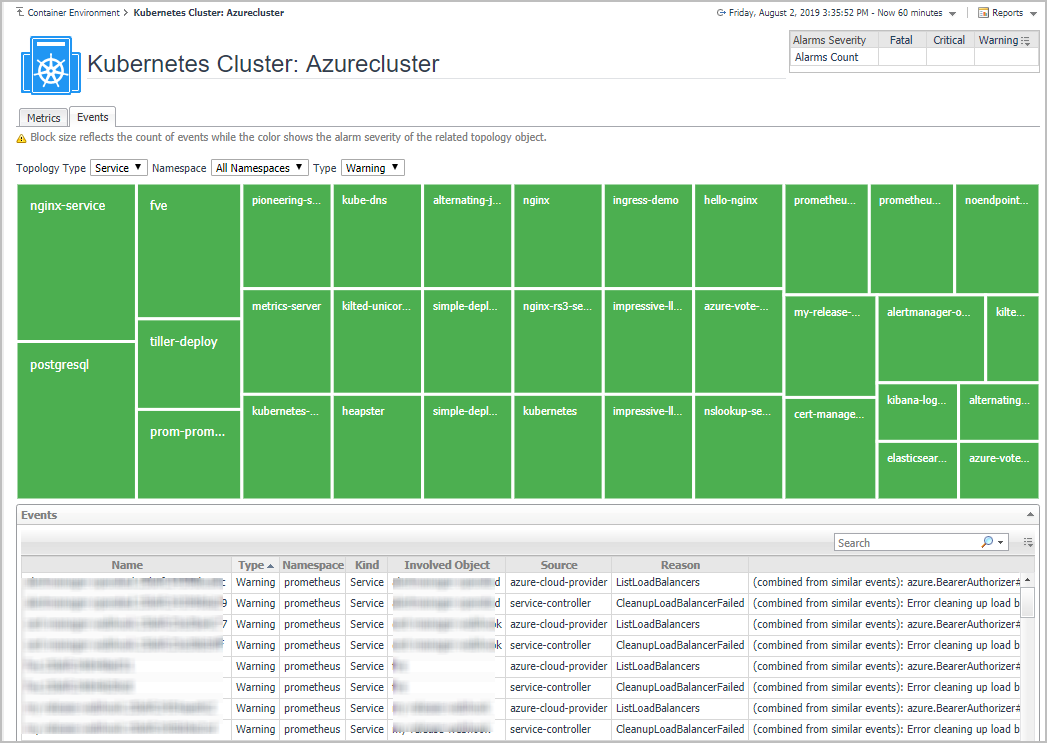
• |
Topology Type: Indicates the Kubernetes components on which the event occurs, including Pod, Node, and Service. |
|
• |
Namespace: Use the namespaces to filter the events. |
|
• |
Type: Indicates the severity of the event, including warning and normal. |
The topology view visualizes the relationships between the objects from the pods accessible aspect in your environment through an interactive dependency map. The map illustrates how different components relate to each other, and the levels of the available resources available to them. Click on Pod, another sub topology view will popup to show the relationship from pods controller to storage for the selected Pod. Click other components or click the Pod inside the sub topology view, an information view will popup to show alarms, basic information, some metrics. From the information popup view of Pod, Node and Cluster, click the Explore button will navigate to the explorer view of the selected Pod/Node/Cluster. The NAVIGATOR in the bottom-right corner allows you to easily set the zoom level by dragging the slider into the appropriate position.
|
• |