This view consists of the following two panes:
|
• |
The Swarm Services tree view, which appears on the left of Swarm Services Quick View, lists the docker swarm services existing in the monitored Docker environment. |
|
• |
The Docker Swarm Service Summary view, which appears on the right after you select an individual docker swarm service in the Swarm Services tree view. |
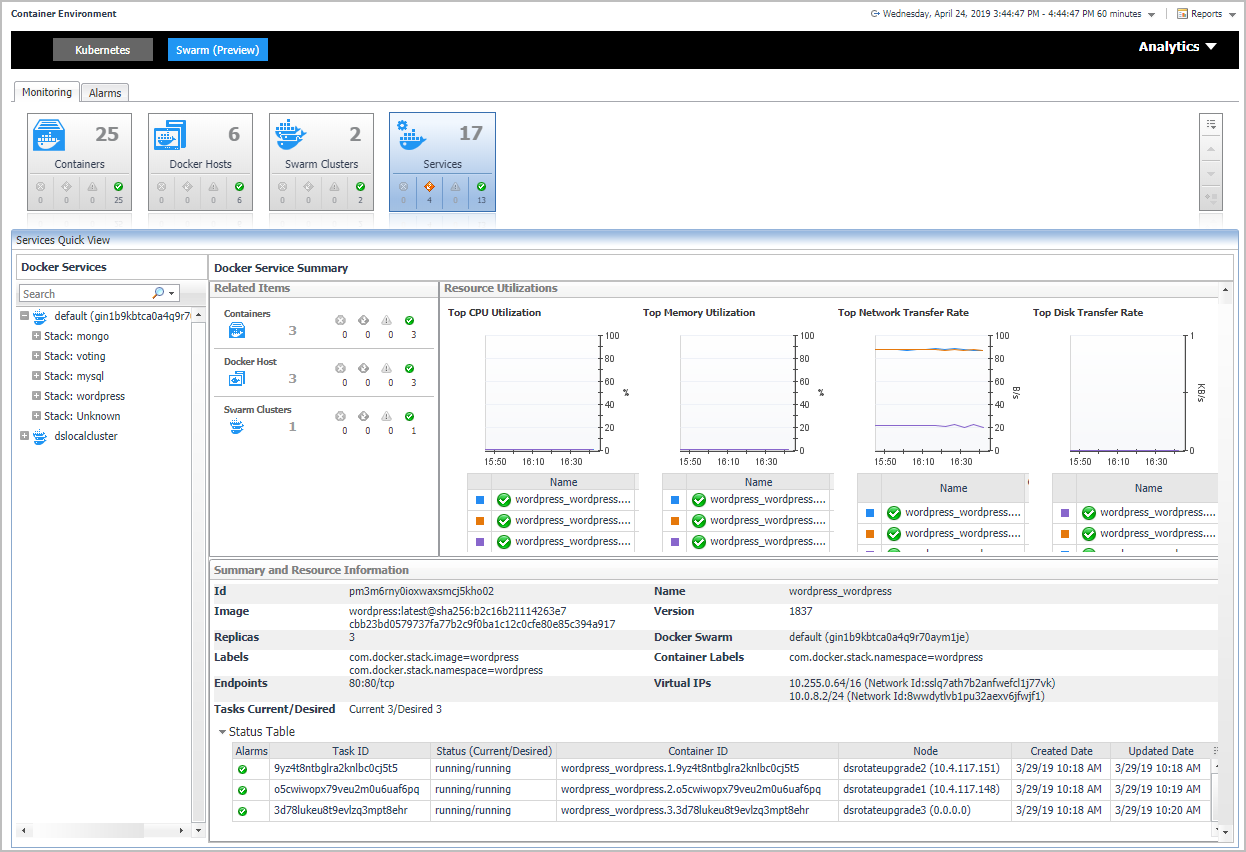
The Docker Service Summary view appears on the right when you select a docker swarm service in the Docker Services tree view.
The Docker Service Summary view displays the following data:
|
• |
Related Items: Shows the related Docker components grouped by type as well as the associated alarms. |
|
• |
Resource Utilizations: Shows CPU Utilization, Memory Utilization, Network Transfer Rate, Disk Transfer Rate metrics of the containers running in this docker swarm service in descending order. |
|
• |
Summary and Resource Information: Shows the summary information of the docker swarm service, including Labels, Image, Mount Volumes, Ports, Container Status and so on. |
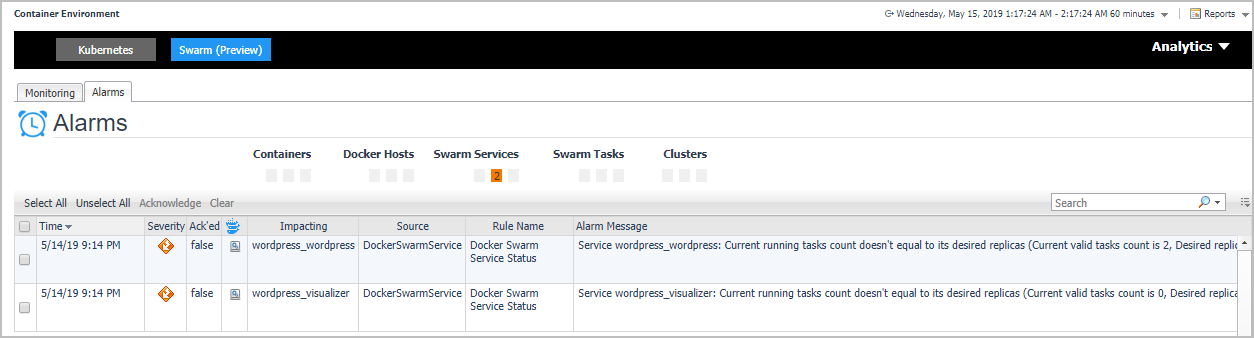
The Alarms dashboard displays a list of alarms generated against the monitored Docker environment. Use this view to quickly identify any potential problems related to a specific Docker component.
Foglight for Container Management provide analytics feature for Kubernetes and Docker Swarm.