|
1 |
On the navigation panel, under Dashboards, click Application Servers > Monitor. The Application Servers Monitor dashboard opens. |
|
2 |
Click the Servers tile. |
|
1 |
On the navigation panel, under Dashboards, click Application Servers > Monitor. The Application Servers Monitor dashboard opens. |
|
2 |
Click the Servers tile. |
|
3 |
Click Quick View, or the edit icon beside the text. |
|
5 |
Click OK to close the dialog box. The Quick View refreshes. |
|
1 |
On the navigation panel, under Dashboards, click Application Servers > Monitor. The Application Servers Monitor dashboard opens. |
|
2 |
Click the Systems tile. |
|
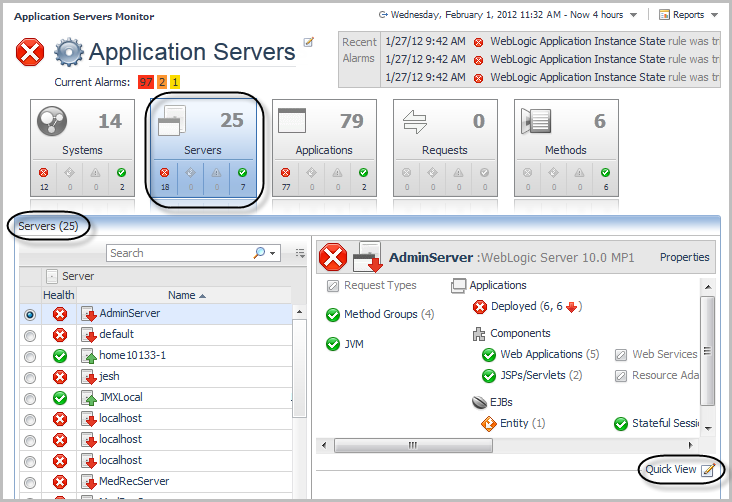
1 |
On the navigation panel, under Dashboards, click Application Servers > Monitor. The Application Servers Monitor dashboard opens. |
|
2 |
Click the Servers tile. |
|
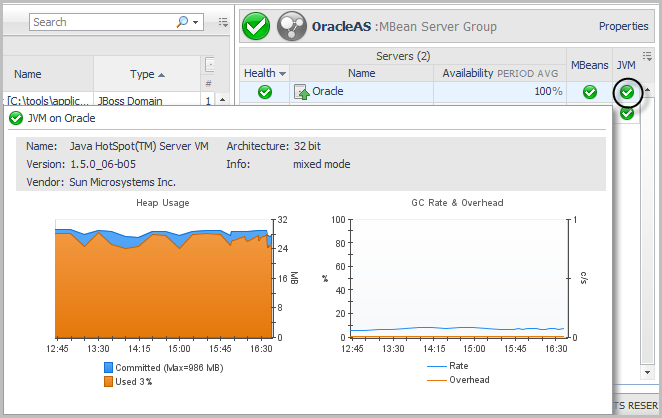
• |
Hover your mouse over the JVM link in the server details area to open a dwell that displays the Heap Usage and GC Rate & Overhead charts. Click the Heap Usage chart in this dwell to open the JVM view. |
|
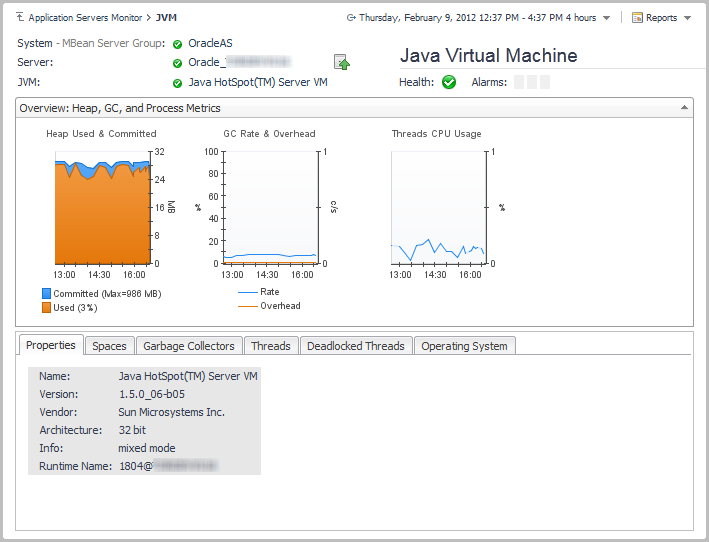
• |
Click JVM in the server details view. The JVM view opens. |
|
• |
Click Quick View, located just below the server details view, and select JVM - Heap Usage from the dialog box that opens. Click OK. The JVM Heap Usage chart appears in the Quick View area. |
|
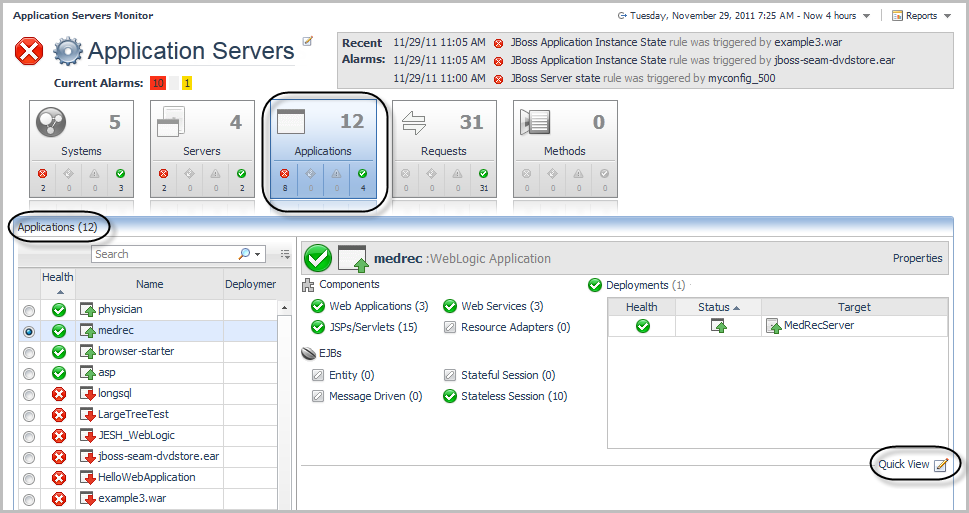
1 |
On the navigation panel, under Dashboards, click Application Servers > Monitor. The Application Servers Monitor dashboard opens. |
|
2 |
Click the Applications tile. |