|
1 |
On the navigation panel, under Dashboards, click Application Servers > Monitor. |
|
2 |
On the Application Servers Monitor dashboard, click the Methods tile. |

|
NOTE: It is strongly recommended that you make a backup of the default agent profile before editing.
NOTE: You must restart your instrumented application servers after editing the instrumentation configuration (agent/instrumentation.config) in order for the changes to take effect. |
|
1 |
On the navigation panel, under Dashboards, click Application Servers > Administration > Application Servers Administration. |
|
2 |
On the Application Servers Administration dashboard, click Java Administration. |
|
3 |
On the Java Administration page, click the Agent Configurations tab. |
|
b |
|
d |
Click Copy. |
|
e |
A message box opens. Click Close. |
|
6 |
Select Edit instrumentation settings. |
|
7 |
Click the Named Methods tab. |
|
8 |
Click Edit |
|
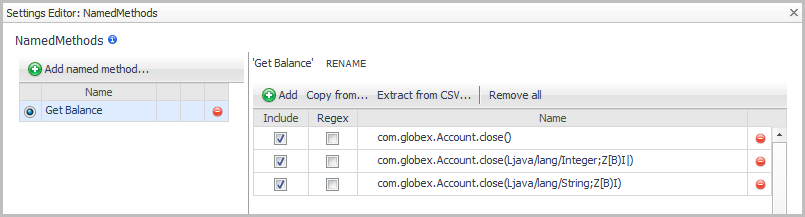
9 |
In the Settings Editor, click Add named method. |
|
11 |
Click OK. |
|
12 |
Click Add. This adds a row to the method list table. |
|
13 |
Click in the Name box and type the name of the method. |

|
16 |
Click Save. The Configuration Category Editor closes. |
|
1 |
On the Application Servers Monitor dashboard, click a tile (Systems, Servers, Applications, Requests, or Methods). |

|
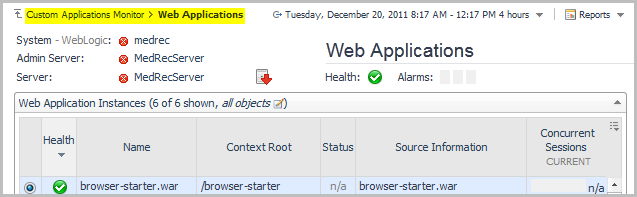
3 |
In the upper left corner of the popup, click Web Applications to open the drilldown view in the display area. |