|
1 |
|
2 |
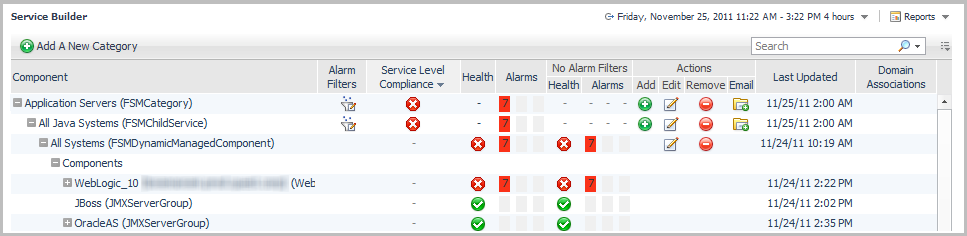
Expand the Application Servers service category. The grouping underneath the service category appears. |
|
1 |
|
2 |
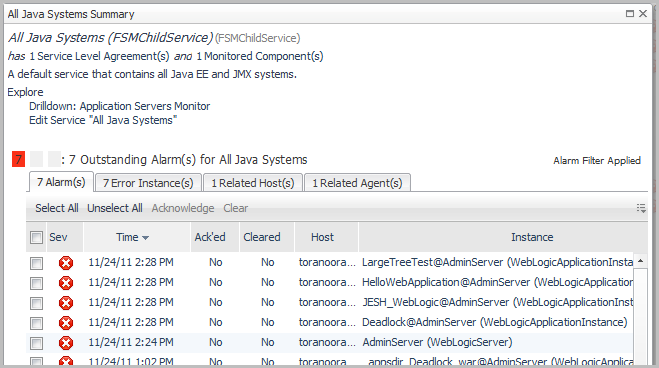
Under the Explore heading, click Drilldown: Application Servers Monitor to view the details of the service in the Application Servers Monitor dashboard. |
|
1 |
On the navigation panel, under Dashboards, click Application Servers > Monitor. The Application Servers Monitor dashboard opens. |
|
2 |
Click the Systems tile. |


|
• |

|
1 |
In the Applications column of the Servers table, click the health status icon. |

|
2 |
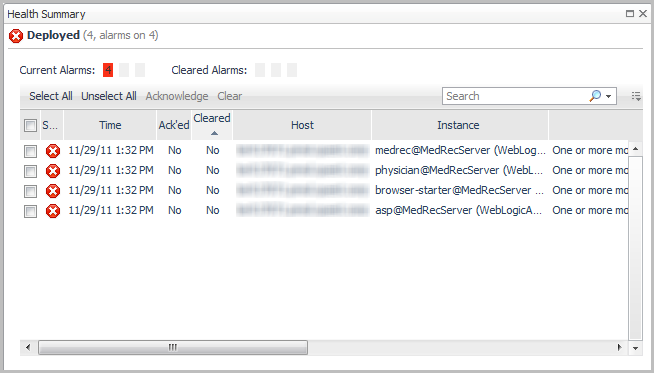
Click the Deployed health status icon. |