|
1 |
In the navigation panel, under Dashboards, click APM > Search > Sessions. |
|
2 |
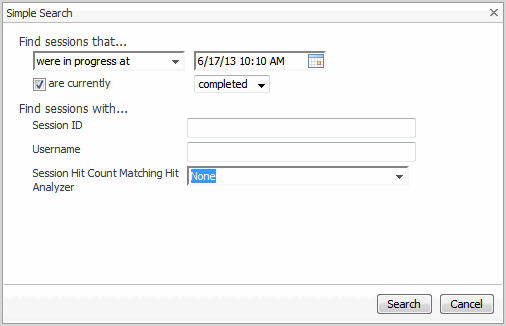
Click Simple Search. |
|
TIP: An APM Administrator can increase or decrease the maximum time range displayed in the time range list through the Configure Advanced Options > Settings dashboard. See the Search Time Range Limit option under the Archiver Query Settings. | |
|
4 |
Click Search. |
|
1 |
In the navigation panel, under Dashboards, click APM > Search > Session. |
|
2 |
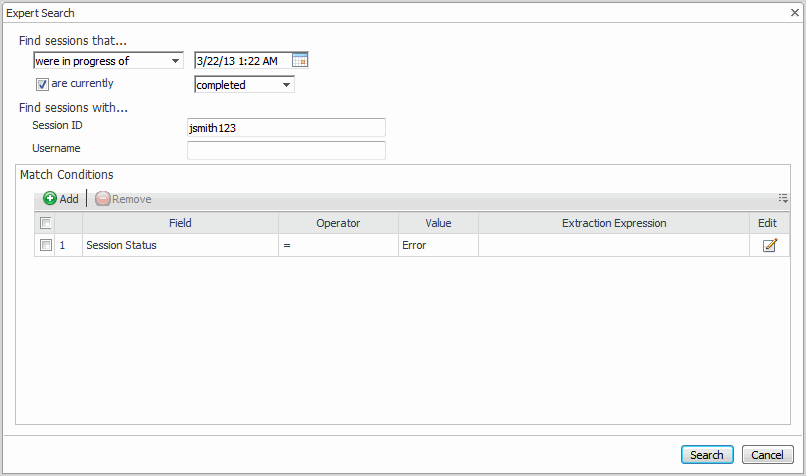
Click Expert Search. |
|
TIP: An APM Administrator can increase or decrease the maximum time range displayed in the time range list through the Configure Advanced Options > Settings dashboard. See the Search Time Range Limit option under the Archiver Query Settings. | |
|
Optional—specify one or more conditions to match. Click Add. You can define a condition based on any detail or metric listed in the Source list. For help creating match conditions, see Defining match conditions for expert searches. |
|
4 |
Click Search. |
|
5 |
|
TIP: By default, a session search returns a maximum of 200 sessions. An APM Administrator can change this limit using the Session Search Result Limit setting in the Configure Advanced Options > Settings dashboard. |

|
The Session Explorer | |||||||||
| |||||||||
|
Displays the length of the session since the Start Time. | |||||||||
|
If username rules are defined, displays the user name associated with the session. For more information, see “Associating user names with user sessions” in the Foglight APM Administration and Configuration Guide. | |||||||||
|
Displays the number of hits with the specified error contained within the session at the time of the search. Show columns for Custom Errors, Reset Errors, HTTP Errors, Client Errors, Server Errors, or Timeout Errors. |
