Chatee ahora con Soporte
Chat con el soporte

Foglight for Hyper-V 7.1.0 - User Guide

About Hyper-V Monitoring in Foglight Evolve Cloud Agent administration Performance monitoring with the Hyper-V Environment dashboard Performance investigation with the Hyper-V Explorer Hyper-V Monitoring in Foglight Evolve Cloud alarms Appendix: Hyper-V Agent error codes

Performance monitoring with the Hyper-V Environment dashboard

Performance monitoring with the Hyper-V Environment dashboard

A typical virtual environment contains a set of physical servers and virtual machines. A physical server can be a part of a cluster, and can have one or more virtual machines associated with it. You can view the overall state of these components on the Hyper-V Environment dashboard.

Accessing the Hyper-V Environment dashboard

When you navigate to the Hyper-V Environment dashboard for the first time, the Monitoring tab appears. This tab provides an overall summary of your virtual environment.


To access the Hyper-V Environment dashboard:

3
On the navigation panel, under Homes, click Hyper-V Environment. The Hyper-V Environment dashboard appears in the display area.
The Hyper-V Environment dashboard shows summary information about the clusters, servers, and virtual machines in your environment, and additional information about each specific component.
4
Select the Clusters, Servers, Virtual Machines, SOFS Servers, SCVMM Servers, Storage, or Virtual Switches tile from the top left.

Monitoring tab

The Monitoring tab allows you to select a monitoring object or a group of objects, such as clusters, servers, virtual machines, virtual switches, or volumes, and review the data associated with your selection. For example, selecting all servers identifies the top three consumers of CPU, memory, network, and disk resources and shows the related alarm states. Selecting a specific server shows the CPU, memory, network, and disk usage for the selected server, along with high-level hardware and software configuration.

Gauge charts

he data of CPU, memory, network, and disk usage are represented using a spinner (also known as rotating wheel) which is divided into four severity levels, including Normal (in green), Warning (in yellow), Critical (in orange), and Fatal (in red).


The severity of CPU Load is calculated based on the following formula: (utilization current average - utilization period average)/utilization period standardDeviation. If this value is:

The severity of Network I/O is calculated based on the following formula: (transferRate current average - transferRate period average)/transferRate period standardDeviation. If this value is:

The severity of Memory Load is calculated based on the following formula: (currentPressure current average - currentPressure period average)/currentPressure period standardDeviation. If this value is:

The severity of Disk usage is calculated based on the following formula: (diskTransferRate current average - diskTransferRate period average)/diskTransferRate period standardDeviation. If this value is:


1
2


Table 3. SOFS Servers

Shows the number of Scale-Out File Server (SOFS) in your environment and total alarm counts associated with them.

Alarm counts. The total counts of alarms associated with the SOFS servers, broken down by alarm types (Normal, Warning, Critical, Fatal).
Server count. The number of SOFS servers in your environment.

Drill down on:

Alarm counts. Lists the SOFS servers associated with the alarms in the [REFERENCE] SOFS Servers view, appearing in the [REFERENCE] Quick-View.
Servers. Displays servers-related combination of views in the [REFERENCE] Quick-View.


[REFERENCE] Summary - All Servers view[REFERENCE] Server Summary view


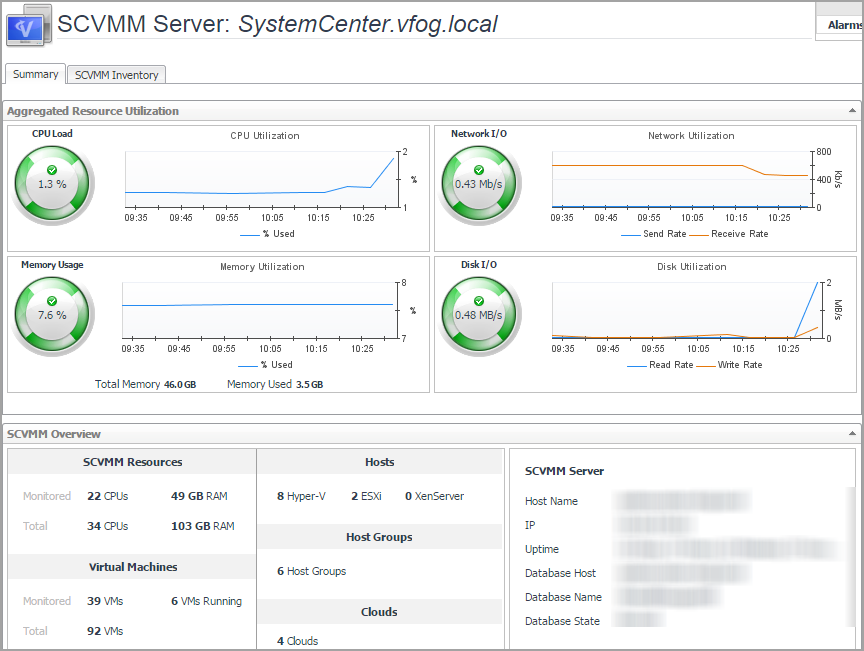
Summary: Includes the following embedded views:
SCVMM Inventory: Includes the following embedded views:


Shows the resource consumption for the selected SCVMM server, broken down into four simple views.

CPU Load. The current percentage of the selected SCVMM server’s CPU load, used to execute system code and user programs, based on the total CPU capacity allocated to that SCVMM server.
CPU Utilization, % Used. The percentage of the SCVMM server’s CPU utilization spent on executing system code and user programs during the selected time period.
Disk I/O. The current disk I/O rate for the selected SCVMM server.
Disk Utilization, Read Rate. The rate at which the SCVMM server reads data from the disk during the selected time period.
Disk Utilization, Write Rate. The rate at which the SCVMM server writes data to the disk during the selected time period.
Memory Usage. The current percentage of the average memory usage by the selected SCVMM server, based on the total memory capacity.
Memory Usage, Total Memory. The total memory capacity allocated to the selected SCVMM server.
Memory Utilization, % Used. The percentage of the available memory that the SCVMM server uses during the selected time period.
Network I/O. The current rate at which the selected SCVMM server transfers data from and to the network.
Network Utilization, Receive Rate. The rate at which the selected SCVMM server receives data from the network during the selected time period.
Network Utilization, Send Rate. The rate at which the selected SCVMM server sends data to the network during the selected time period .

Drill down on:

CPU Load spinner. Displays the CPU Load dialog box.
Figure 11. CPU Load dialog box
CPU Utilization graph. Displays the CPU Utilization dialog box.
Figure 12. CPU Utilization dialog box
Disk I/O spinner. Displays the Disk I/O dialog box.
Figure 13. Disk I/O dialog box
Disk Utilization graph. Displays the Disk Utilization dialog box.
Figure 14. Disk Utilization dialog box
Memory Usage spinner. Displays the Memory Usage dialog box.
Figure 15. Memory Usage dialog box
Memory Utilization graph. Displays the Memory Utilization dialog box.
Figure 16. Memory Utilization dialog box
Network I/O spinner. Displays the Network I/O dialog box.
Figure 17. Network I/O dialog box
Network Utilization graph. Displays the Network Utilization dialog box.
Figure 18. Network Utilization dialog box

Indicates the overall information of the selected SCVMM server.

SCVMM Resources. Shows the CPU and memory information.

Monitored: Shows the number of CPU and memory of Hyper-V servers that are managed by the selected SCVMM server and are also monitored by the Hyper-V agents.
Total: Shows the numbers of CPU and memory that are managed by the selected SCVMM server.

Virtual Machines. Shows the VM related information.

Monitored: Shows the number of VMs/running VMs that are managed by the selected SCVMM server and are also monitored by the Hyper-V agents.
Total: Shows the total number of virtual machines that are managed by the selected SCVMM server.

Hosts. Shows the list of hosts available in the selected SCVMM Server.

Host Groups. Shows the number of host groups available in selected SCVMM Server.

Clouds. Shows the number of clouds available in the selected SCVMM Server.

SCVMM Server. Shows the state of the selected SCVMM Server, including Host Name, IP, Uptime, Database Host, Database Name, and Database State.

If there are no IP and Uptime metrics displayed in the SCVMM Server area, this should be caused by one of the following:

The selected SCVMM server is not monitored by host agents. In this case, create a host agent to monitor this SCVMM server to obtain the IP and Uptime metrics. For more information about creating a host agent, see the Foglight Agent Manager Guide.


Indicates the information of clouds that are monitored by the selected SCVMM server.

Name. The name of cloud on which the selected SCVMM server is monitored.

Host Groups. The name of the host group that is used by the cloud.

Logical Networks. The name of the logical network that is used by the cloud.

VM Usage. The number of virtual machines that are used by the cloud.

Custom Quota Usage. The points of custom quota.

CPU Usage. The number of virtual CPUs that are used by the cloud.

Memory Usage. The maximum memory (in megabyte) that can be used by all virtual machines.

Storage Used. The number of storage (in gigabyte) that is used by the cloud.

Storage Committed. The total storage capacity (in gigabyte) of all virtual hard disks on the cloud.

Indicates the information of Host Groups that are monitored by the selected SCVMM server.

Name. The name of the Host Group.

Host Count. The number of hosts.

VM Count. The number of the virtual machines.

Hypervisors. The type of hypervisor included in the host group.

Indicates the information of Library Servers that are monitored by the selected SCVMM server.

Library Server. The name of the Library Server.

Computer Name. The host name of the Library Server.

SCVMM Name. The Fully Qualified Domain Name (FQDN) of the selected SCVMM server.

Allow Unencrypted Transfers. Specifies whether the unencrypted transfer is allowed or not.

Domain Name. The name of domain.

Description. Describes the Library Server.

Is Virtual Cluster Name. Specifies whether the Library Server is a virtual cluster or not.

iscsi SAN Status. Indicates the status of the ISCSI SAN that is connected to the Library Server.

Is Cluster Node. Specifies whether the Library Server is a cluster node or not.


Indicates the information of networks that are monitored by the selected SCVMM server.

Select a Network. Lists available networks in the selected SCVMM server.

Networks - <name of selected network>.

Description. Includes the following information: SVCMM Server, Network Virtualization, useGRE, and isPVLAN.
Host Group(s). Lists available Host Groups on the selected network.
Clouds. Lists available Clouds on the selected network.
VMNetworks. Lists available virtual machine networks on the selected network.


Indicates the information of database servers that are monitored by the selected SCVMM server.

SCVMM Server. The FQDN of the selected SCVMM server.

Availability. Specifies whether the database is available or not.

Database Host. The host name of the database server.

Database Instance. The instance name of the database server.

Database. The name of the database server.


Indicates the information of Services that are monitored by the selected SCVMM server.

Services Deployed to Clouds.

Name. The name of the service.
Clouds. The name of the cloud.
Deployment State. Shows the deployment state of the service.
In Servicing Mode. Specifies the service enters the servicing mode or not.
Computer Tiers. Indicates the tier type.
Description. Descriptions of the service.

Services Deployed to Host Groups.

Name. The name of the service.
Host Groups. Lists the virtual machine host groups.
Deployment State. Shows the deployment state of the service.
In Servicing Mode. Specifies the service enters the servicing mode or not.
Computer Tiers. Indicates the tier type.
Description. Descriptions of the service.


Indicates the information of storage that is monitored by the selected SCVMM server.

Storage Classifications.

Storage Name. The name of storage.
Description. Descriptions of the selected storage.
Enabled. Specifies whether the storage is enabled or not.
Clouds. Lists the clouds that are using the selected storage.

Storage Providers.

Storage Name. The name of storage provider.
Provider Type. The type of the storage provider.
Description. Descriptions of the storage provider.
Enabled. Specifies whether the storage is enabled or not.
SCVMM Name. The name of the SCVMM server.
Network Address. The network address of the selected storage.
Provider Status. Indicates the status of the storage provider.
Provider Flags. Indicates the flag of the storage provider.
Documentos relacionados

The document was helpful.

Seleccionar calificación

I easily found the information I needed.

Seleccionar calificación