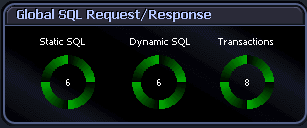
The Global SQL Request/Response panel on the instance home page provides an overview of all the SQL activity across all active databases within the instance. These spinners are providing counts for this activity, but not rates. For rates that correspond to these counts, access the appropriate home page for the particular database or partition, or open the Top SQL drilldown.
The following illustration is an example of the Global SQL Request/Response panel.

You can use the Metric Editor to modify the thresholds for the metric behind the statistic in each of these components to generate appropriate alarms. Review the following for additional information:
| Static SQL |
The number of static SQL statements executed across all active databases in the instance. Note: In multiple-partition environments, the Database Manager Summary drilldown provides this statistic for each active partition on the system. Additionally, the All Nodes row shows a running total for this statistic across all partitions. |
| Dynamic SQL |
The number of dynamic SQL statements executed across all active databases in the instance. Note: In multiple-partition environments, the Database Manager Summary drilldown provides this statistic for each partition on the system. Additionally, the All Nodes row shows a running total for this statistic across all partitions. |
| Transactions |
Transactions The number of commits and rollbacks completed per second within the instance. This number includes both internal transactions that the database manager executes and transactions completed at the application level. Note: In a multiple-partition database, information is presented for each active partition on the system. An All Nodes row keeps a running total for all partitions. In a single-partition database, only the All Nodes information is presented. |