Virtual Machine Summary view
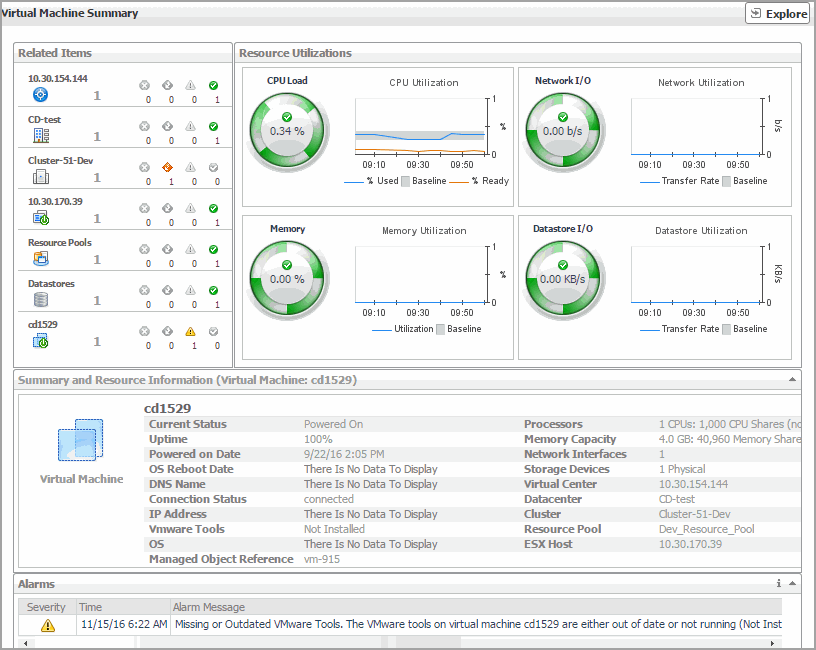
The Virtual Machine Summary view shows the overall resource utilization and the amounts of system resource consumption for a virtual machine.

The Virtual Machine Summary view appears on the right.
This view is made up of the following embedded views:
|
|
Lists the summary and resource information of the selected virtual machine. |
|
|
|
• |
Current Status. The current status of the selected virtual machine: Turned off or Powered On. | |
|
|
|
• |
Processors. The number of CPUs used by the selected virtual machine. | |
|
|
|
• |
Uptime. The percentage of time during which the virtual machine is running. | |
|
|
|
• |
Memory Capacity. The amount of memory resources allocated to the selected virtual machine. | |
|
|
|
|
|
|
• |
Network Interface. The number of network interface cards that exist on the selected virtual machine. | |
|
|
|
|
|
|
• |
Storage Devices. The number of physical and logical disks associated with the virtual machine. | |
|
|
|
• |
DNS Name. The fully qualified DNS name of the selected virtual machine. | |
|
|
|
• |
Virtual Center. The IP address of the Virtual Center to which the virtual machine belongs. | |
|
|
|
|
|
|
• |
Datacenter. The name of the datacenter associated with the virtual machine. | |
|
|
|
• |
IP Address. The IP address of the virtual machine. | |
|
|
|
• |
Cluster. The name of the cluster associated with the virtual machine. | |
|
|
|
• |
Vmware Tools. The name of VMware applications used to manage the virtual machine. | |
|
|
|
• |
Resource Pool. The name of resource pools associated with the virtual machine. | |
|
|
|
• |
OS. The name of the operating system used by the selected virtual machine. | |
|
|
|
• |
ESX Host. The IP address of the ESX host on which the virtual machine is running. | |
|
|
|
|
|
Shows the numbers and states of the selected virtual machine and other components associated with it. |
|
|
|
• |
Cluster. The name of the cluster associated with the selected virtual machine, followed by the related alarm counts. | |
|
|
|
• |
Datacenter. The name of the datacenter associated with the selected virtual machine, followed by the related alarm counts. | |
|
|
|
• |
Datastores. The number of datastores that are associated with the selected virtual machine, followed by the related alarm counts. | |
|
|
|
• |
ESX Host. The name of the ESX host on which the selected virtual machine is running, followed by the related alarm counts. | |
|
|
|
• |
Resource Pools. The number of resource pools that are associated with the selected virtual machine, followed by the related alarm counts. | |
|
|
|
• |
Virtual Center. The name of the virtual center associated with the selected virtual machine, followed by the related alarm counts. | |
|
|
|
• |
Virtual Machine. The number of the selected virtual machine, followed by the related alarm counts. | |
|
|
Drill down on: |
|
|
|
• |
Alarm count. Displays the Alarms dialog box that shows a list of all related alarms. For each alarm entry, it shows its severity, the time at which it was triggered, the rule name that triggered the alarm, and the alarm message. |
|
|
|
|
• |
Cluster. Displays the Clusters Inventory dwell, showing the name and state of the cluster associated with the selected virtual machine. |
|
|
|
|
• |
Datacenter. Displays the Datacenters Inventory dwell, showing the name and state of the datacenter associated with the selected virtual machine. |
|
|
|
|
• |
Datastores. Displays the Datastores Inventory dwell, showing the names and states of all datastores that are associated with the selected virtual machine. |
|
|
|
|
• |
ESX Host. Displays the ESX Hosts Inventory dwell, showing the name and state of the ESX host associated with the selected virtual machine. |
|
|
|
|
• |
Resource Pools. Displays the Resource Pools Inventory dwell, showing the names and states of all resource pools that are associated with the selected virtual machine. |
|
|
|
|
• |
Virtual Center. Displays the Virtual Centers Inventory dwell, showing the name and state of the virtual center associated with the selected virtual machine. |
|
|
|
|
• |
Virtual Machine. Displays the Virtual Machines Inventory dwell, showing the name and state of the selected virtual machine. |
|
Summary - All Virtual Machines view
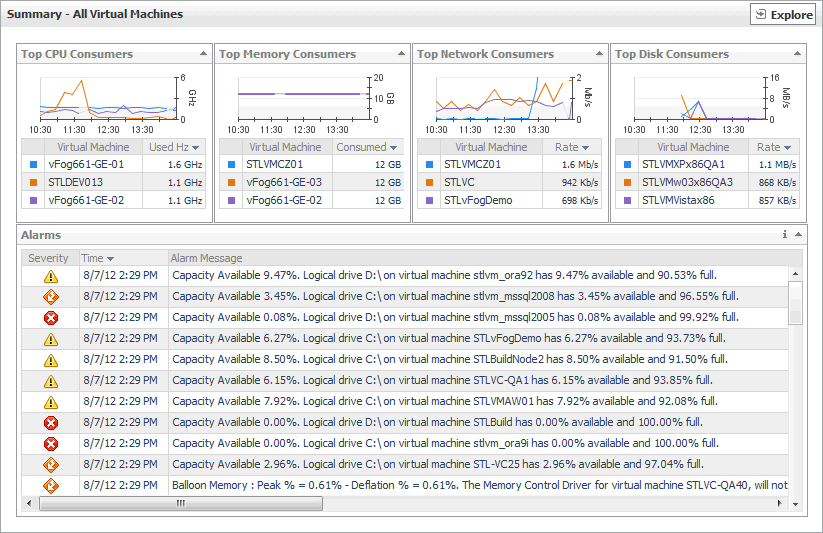
The Summary - All Virtual Machines view displays overall resource utilization information for a group of virtual machines and shows the elements that consume the highest amount of system resources.

The Summary - All Virtual Machines view appears on the right.
This view is made up of the following embedded views:
Virtual Machines view
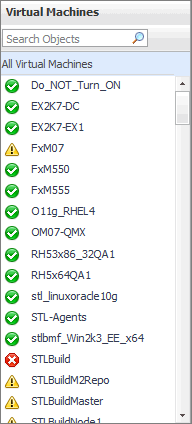
This view is a tree view. It lists the virtual machines that exist in your environment and shows their state.

Selecting the All Virtual Machines node displays overall resource utilization for all virtual machines in your integrated system, and the elements that consume the highest amount of system resources in the Summary - All Virtual Machines view on the right. Similarly, selecting a Virtual Machine node shows Virtual Machine-specific metrics in the Virtual Machine Summary view view on the right.
Summary - Standard Virtual Switch view
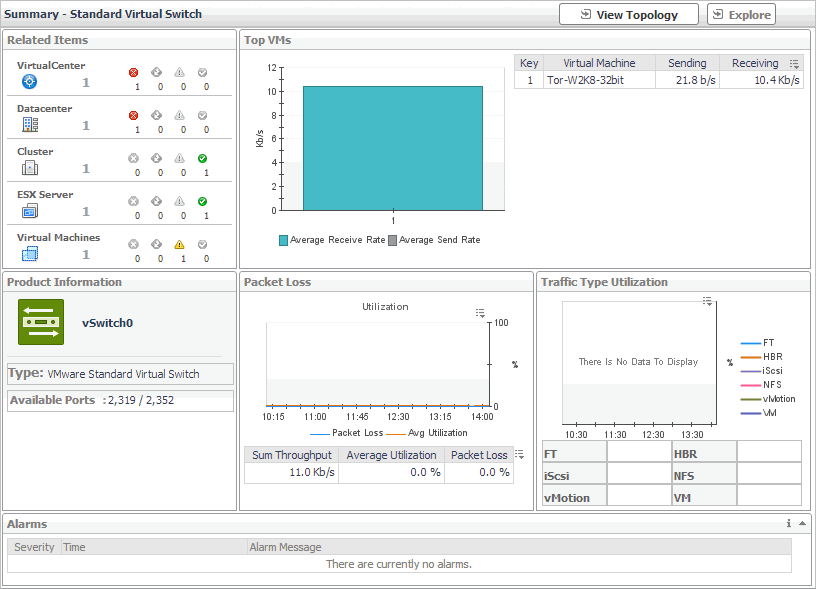
The Summary - Standard Virtual Switch view illustrates the overall network utilization and the levels of overall network packet loss for a selected standard virtual switch.

The Summary - Standard Virtual Switch view appears on the right.
This view is made up of the following embedded views:
|
|
Shows the numbers and states of the objects in your environment associated with the selected switch. |
|
|
|
• |
Cluster. Represents the cluster associated with the selected switch, followed by the counts of alarms generated against that cluster in each severity state. | |
|
|
|
• |
Datacenter. Represents the datacenter associated with the selected switch, followed by the counts of alarms generated against that datacenter in each severity state. | |
|
|
|
• |
Virtual Center. Represents the virtual center associated with the selected switch, followed by the counts of alarms generated against that virtual center in each severity state. | |
|
|
|
• |
Virtual Machine. Represents the virtual machines associated with the selected switch, followed by the counts of alarms generated against those virtual machines in each severity state. | |
|
|
Drill down on: |
|
|
|
• |
Alarm count. Displays the Alarms dialog box that shows a list of all related alarms. For each alarm entry, it shows its severity, the time at which it was triggered, the rule name that triggered the alarm, and the alarm message. | |
|
|
|
• |
Cluster. Displays the Clusters Inventory dwell, showing the name and state of the cluster associated with the selected switch. |
|
|
|
|
• |
Datacenter. Displays the Datacenters Inventory dwell, showing the name and state of the datacenter associated with the selected switch. |
|
|
|
|
• |
Virtual Center. Displays the Virtual Centers Inventory dwell, showing the name and state of the virtual center associated with the selected switch. |
|
|
|
|
• |
Virtual Machines. Displays the Virtual Machines Inventory dwell, showing the name and state of each virtual machine associated with the selected switch. |
|