Viewing, Acknowledging, and Clearing Alarms
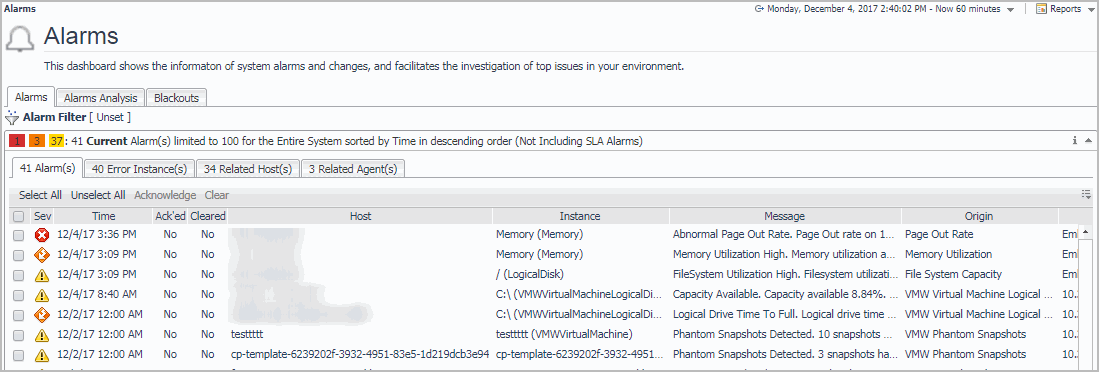
Input “Alarms” in the Search textbox on the Foglight Home page to access the Alarms dashboard.
|
• |
Blackouts tab: See the “Blackout Configuration” section in the Foglight Administration and Configuration Help. |
The maximum number of alarms for the selected time range is set to 5000 by default. To change this value, type the number in the Max Number of Evaluated Alarms field, and then click Apply. The Max Number of Evaluated Alarms is scaled from 0 to 100,000 and is managed by the Alarm_Analysis_Max_Object variable. To change the value of this variable, search for and edit Alarm_Analysis_Max_Object from Dashboards > Administration > Rules & Notifications > Manage Registry Variables.
|
NOTE: It is not recommended that the value of Alarm_Analysis_Max_Object is set to be larger than 100,000; otherwise the loading of the Alarm Analysis view will be unsatisfactorily slow. |
The Alarms Analysis (Preview) view contains the following elements:
|
• |
Alarms by Source: Lists all alarms (cleared or non-cleared) that are triggered by the alarm source. For more information about alarm sources, click Dashboards > Administration > Rules & Notifications > Rules. |
|
• |
Counts by Severity chart: Summarizes the totals for each severity of alarm (Warning, Critical, or Fatal) and the total number of alarms. |
|
• |
Alarms by Service: Summarizes the total alarms and agents that are not included in services, as well as all alarms (cleared or non-cleared) that are triggered by services. For more information about services, click Dashboards > Services > Service Builder. |
The alarm list view allows you to select different perspectives on alarms. This chapter discusses using the Alarm(s) tab. For information about using the other tabs, see Alarm List.
Viewing Alarms
This topic discusses viewing alarms in more detail.
For example, you can filter the list of alarms to show only Current or Historical alarms. Select Current to shows all outstanding alarms. This is essentially the current outstanding set of alarms that need to be addressed. Use Current if you want to see what is immediately noteworthy. In contrast to Current, Historical shows all alarms that fired during a certain interval, regardless of whether they are active or cleared. Use Historical if you want to see what is happening in your monitored environment during a specific time range.
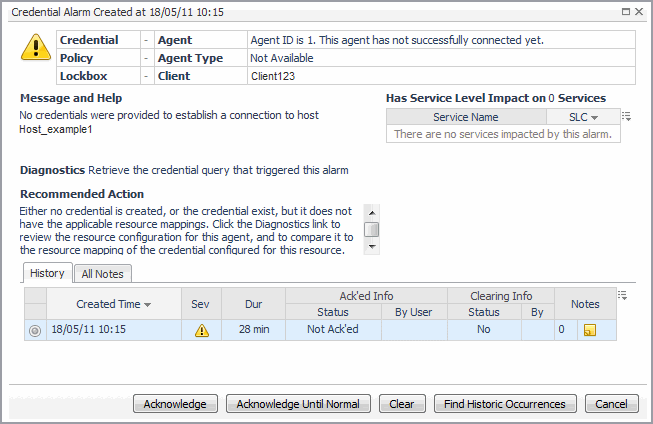
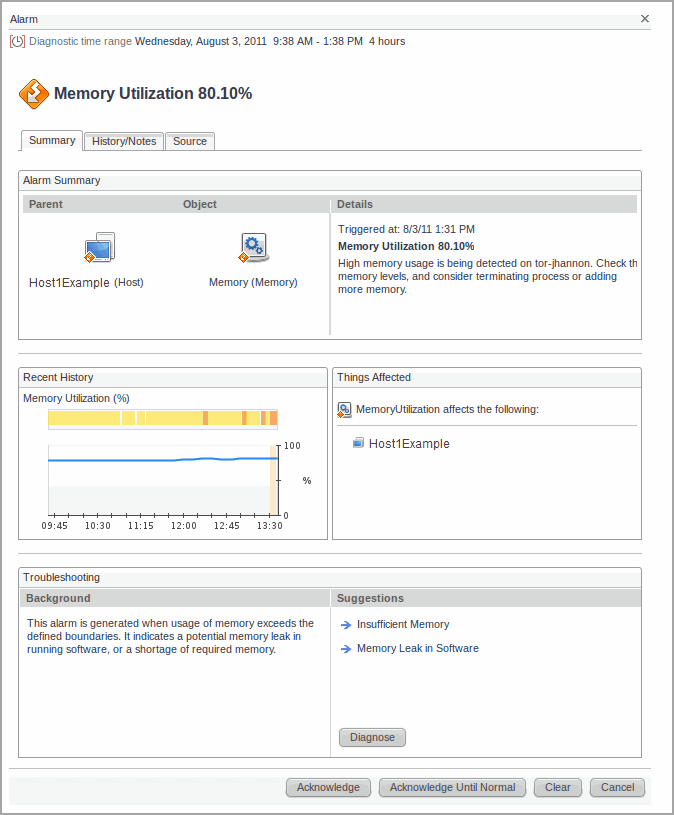
The Alarm Details dialog box also illustrates how the alarm has changed in the current alarm chain. See Alarm Chaining.
If an alarm has an association set up and is triggered by a rule, the following dialog box appears:
You can view, filter, add, and edit alarm notes from the Alarm Details dialog box. Use the History tab to attach notes to a particular alarm in the history table. Use the All Notes tab to attach a note to the most recent alarm in the alarm history. For more information, Alarm Notes.
Acknowledging an Alarm
If you have the Advanced Operator role, you can acknowledge alarms. To acknowledge multiple alarms at once, follow the instructions in To acknowledge one or more alarms: . To cause alarms to remain acknowledged until the monitored object returns to a normal state, follow the instructions in To acknowledge an alarm until the alarm source returns to a normal state: .
|
3 |
Click Acknowledge at the top of the table. |
|
2 |
In the Alarm(s) list, click No in the row for the alarm. |
|
3 |
Click Acknowledge Until Normal. |
Clearing an Alarm
|
3 |
Click Clear at the top of the table. |


