Chat now with support
Chat mit Support

Foglight for VMware 5.8.3 - User Guide

Using Foglight for VMware
Introducing the virtual infrastructure Navigation basics Interacting with Foglight for VMware VMware Performance Agent configuration
Reference
Views
VMware Alarms views VMware Explorer views VMware Modeler views VMware VirtualCenter views VMware Environment views Other views
Rules
Agent Rules Cluster Rules Datacenter Rules Datastore Rules Resource Pool Rules ESX Server Rules VirtualCenter Rules Virtual Machine Rules VMW Stale Data Management Rule Virtual Switch Rules
Appendix: Alarm Messages Appendix: Metrics

Summary - All Virtual Switches view

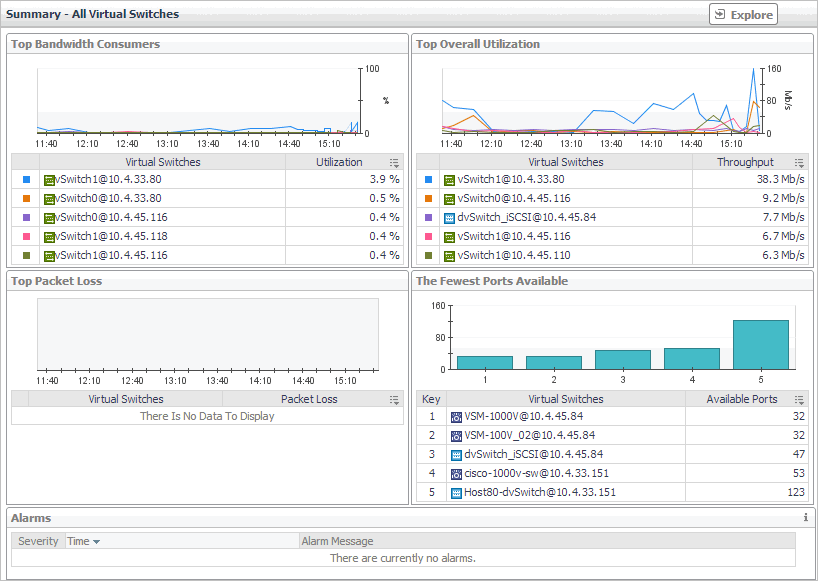
The Summary - All Virtual Switches view displays overall resource utilization information for a group of virtual switches and identifies the elements that consume the highest amount of system resources and may cause potential performance bottlenecks.

1
On the VMware Environment dashboard, on the Monitoring tab, in the Virtual Environment Overview, select the Virtual Switches tile.
2
In the Quick-View, in the Virtual Switches view, select All Virtual Switches.
The Summary - All Virtual Switches view appears on the right.

This view is made up of the following embedded views:

For complete information about this view, see Alarms .

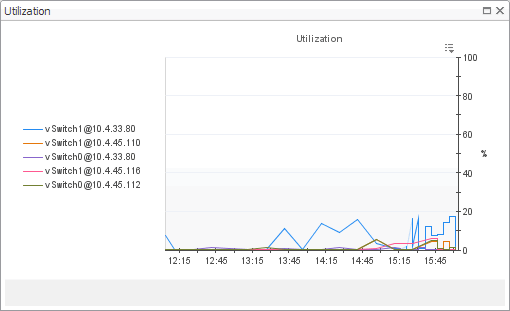
Identifies the virtual switches with the highest percentage of network utilization.

Top Bandwidth Consumers chart. For each identified virtual switch, the chart displays the percentage of network resources available to it that are in use over the selected time period.
Top Bandwidth Consumers table, Virtual Switches. The name of the virtual identified amongst top bandwidth consumers.
Top Bandwidth Consumers table, Utilization. The percentage of network resources available to it the switch that is currently in use.

Drill down on:

Top Bandwidth Consumers chart. Displays the Utilization dialog box.

Identifies the virtual switches with the fewest numbers of available ports.

The Fewest Ports Available chart. For each identified virtual switch, the chart displays the number of available ports.
The Fewest Ports Available table, Available Ports. The number of ports that the virtual switch has available.
The Fewest Ports Available table, Key. The place of the virtual switch in the list of fewest available hosts.
The Fewest Ports Available table, Virtual Switches. The name of the identified virtual switch.

Drill down on:

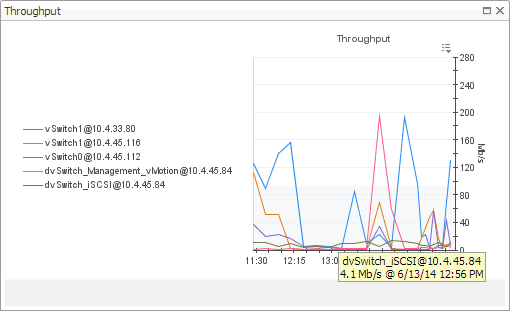
Identifies the virtual switches with the highest network transfer rates.

Top Overall Utilization chart. For each identified virtual switch, the chart displays the network throughput rate over the selected time period.
Top Overall Utilization table, Virtual Switches. The name of the virtual switch identified amongst top network consumers.
Top Overall Utilization table, Throughput. The current rate of network throughput for the selected switch.

Drill down on:

Top Overall Utilization chart. Displays the Utilization dialog box.
Table 190. Top Packet Loss

Identifies the virtual switches with the highest percentage of data packet loss.

Top Packet Loss chart. Identifies the virtual switches with the highest percentage of packet loss over the selected time period.
Top Packet Loss table, Packet Loss. The average percentage of time the data packets sent to the identified virtual switch are not echoed back.
Top Packet Loss table, Virtual Switches. The name of the identified virtual switch.

Drill down on:

Top Packet Loss chart. Displays the Packet Loss dialog box.

Topology views

A typical VMware environment consists of many interrelated components. Understanding the dependencies between specific components in your monitored environment and the levels of resources they consume allows you to better understand resource-related issues, potentially affecting the stability of your system. This can help you predict the impact a potential outage may have on your environment, and to prevent such events, by reallocating resources where they are most needed.

The VMware Environment dashboard includes several topology views that visualize the relationships between the objects in your environment through an interactive dependency map. The map illustrates how different components relate to each other, and the levels of the available resources available to them.

Figure 127. Topology view

The complexity of the information appearing in a dependency map depends on the selected object and the dependencies that object has with other objects within your integrated infrastructure.

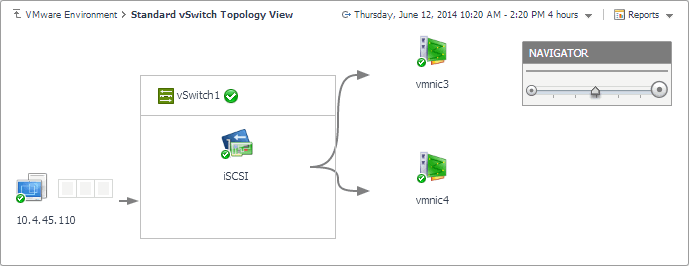
In a large multi-component environment, dependency maps are likely complex and may not fit your screen. The NAVIGATOR in the top-right corner allows you to easily set the zoom level by dragging the slider into the appropriate position.

Figure 128. Navigator view

In a dependency map, some objects are represented with container tiles, others with single-object tiles or just icons. Every object in the map includes an indicator of its health.

Dependencies between the objects in a map are illustrated with single-directional arrows. The color of the arrow reflects the alarm state of the target object: gray for Normal, yellow for Warning, orange for Critical, and red for the Fatal state.

To find out more about an object appearing in the dependency map, click the object icon. A dwell appears, displaying more details about that object. The type and range of information appearing in the dialog box depends on the selected object’s type. For example, drilling down on a virtual switch shows the switch name, alarm counts top virtual machine consumers, levels of traffic utilization, percentage of packet loss, current traffic types, available bandwidth, the numbers of available and all ports, and the number of active versus standby NICs.

Figure 131. Drilldown view

Virtual Switches view

This view is a tree view. It lists the virtual switches that exist in your environment and shows their state.

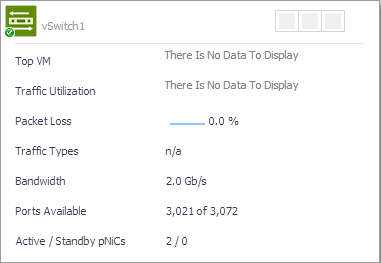
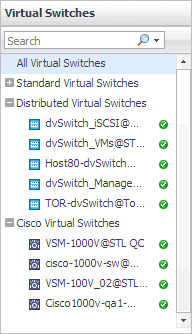
Selecting the All Virtual Switches node displays overall performance statistics for all virtual switches in your integrated system, and identifies the elements that consume the highest amount of system resources in the Summary - All Virtual Switches view on the right. Similarly, selecting a virtual switch node shows Virtual Machine-specific metrics in the Summary - Standard Virtual Switch view, Summary - Distributed Virtual Switch view, or Summary - Cisco Virtual Switch view on the right. The type of the displayed view reflects the type of the selected virtual switch (standard, distributed, or Cisco).

On the VMware Environment dashboard, on the Monitoring tab, in the Quick-View, select the Virtual Switches tile.
The Virtual Switches view appears in the Quick-View on the left.
Alarm severity. The state of the most recent alarm raised against the associated virtual switch.
All Virtual Switches. A parent node for the virtual switch object instances that appear in this view.
Virtual Switches. The virtual machine name.

Drill down on:

Other views

Other views include:

Verwandte Dokumente

The document was helpful.

Bewertung auswählen

I easily found the information I needed.

Bewertung auswählen