Chat now with support
Chat mit Support

Foglight for VMware 5.8.3 - User Guide

Using Foglight for VMware
Introducing the virtual infrastructure Navigation basics Interacting with Foglight for VMware VMware Performance Agent configuration
Reference
Views
VMware Alarms views VMware Explorer views VMware Modeler views VMware VirtualCenter views VMware Environment views Other views
Rules
Agent Rules Cluster Rules Datacenter Rules Datastore Rules Resource Pool Rules ESX Server Rules VirtualCenter Rules Virtual Machine Rules VMW Stale Data Management Rule Virtual Switch Rules
Appendix: Alarm Messages Appendix: Metrics

VMware Modeler views

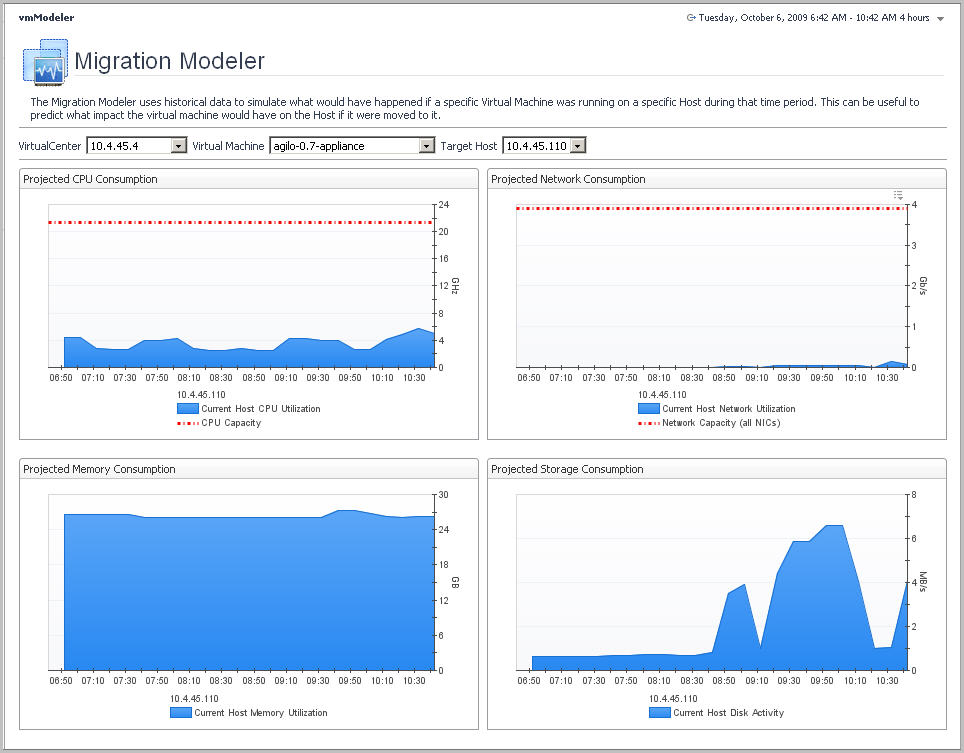
The VMware Modeler dashboard contains the following view:

Migration Modeler view

The Migration Modeler view uses the collected data to show the effect that a virtual machine may have on an ESX host during a selected time period. This view can be used to predict potential performance impacts of moving virtual machines to specific physical ESX hosts.

This view appears on the VMware Modeler dashboard.

This view is made up of the following embedded views:

Shows the projected CPU consumption for the ESX host.

CPU Capacity. The ESX host’s CPU processing speed.
Current Host CPU Utilization. The amount of the ESX host’s CPU resources that is used to execute system code and user programs during the selected time period.

Shows the projected network utilization for the ESX host.

Current Host Network Utilization. The rate at which data is transferred from the ESX host to and from the network during the selected time period.
Network Capacity (all NICs). The ESX host’s network I/O capacity provided by all of the available network interface cards combined.

Shows the projected memory consumption for the ESX host.

Current Host Memory Utilization. The amount of the ESX host’s memory resources that is used during the selected time period.
Memory Capacity. The amount of the ESX host’s memory resources.

Shows the projected disk utilization for the ESX host.

Current Host Disk Activity. The ESX host’s disk I/O rate during the selected time period.

VMware VirtualCenter views

The VMware VirtualCenters dashboard shows a Virtual Center view for each virtual center that exists in your environment

Virtual Center view

This view shows various details about the virtual center.

One or more instances of this view appear on the VMware VirtualCenters dashboard.

Shows the details about the virtual center.

Clusters. The number of all clusters associated with the virtual center, followed by the total counts of alarms associated with the clusters, broken down by alarm types (Normal, Warning, Critical, Fatal).
CPU. The current percentage of the overall virtual center’s CPU load, used to execute system code and user programs, based on the total CPU capacity.
Datacenters. The number of all datacenters associated with the virtual center, followed by the total counts of alarms associated with the datacenters, broken down by alarm types (Normal, Warning, Critical, Fatal).
Disk. The overall datacenter’s current disk I/O rate.
Hosts. The number of all hosts associated with the datacenter, including running and turned-off hosts.
Memory. The current percentage of the virtual center’s memory usage.
Network. The current rate at which the virtual center transfers data from and to the network.
Virtual center. The name of the virtual center, followed by the total counts of alarms associated with the virtual center, broken down by alarm types (Normal, Warning, Critical, Fatal).
VMs. The number of all virtual machines associated with the virtual center, including running and powered-off virtual machines.
Verwandte Dokumente

The document was helpful.

Bewertung auswählen

I easily found the information I needed.

Bewertung auswählen