Chat now with support
Chat mit Support

Foglight for VMware Horizon View 6.0.0 - User Guide

Manage desktops in virtual environments Interact with Foglight for VMware Horizon View dashboards Reference

Performance tab

This tab is available in the VMware Explorer. To find it, open the VMware Explorer and on the Virtual Infrastructure view, that appears on the navigation panel, select a Virtual Center, datacenter, cluster, ESX® host, resource pool, or one of the following containers: Datacenters, ESX Hosts, Resource Pools, or Virtual Machines. In the VMware Explorer, open the Performance tab.

This tab displays the resource utilization for the selected object or group of objects over a selected period of time.

Figure 42. Performance tab

This tab is made up of the following embedded views:

This view shows the CPU utilization summary for the selected component based on its total capacity, including the percentage of available CPU processing that is currently used, and the percentage of time the CPU is ready but is not used due to other reasons, during a selected time period.

This view shows the disk utilization summary for the selected component, including the disk throughput rate, and the rates of data that is read from or written to the disk, during a selected time period.

This view shows a list of all ESX hosts associated with the selected component. For each host, it shows its name, the number of CPUs, the current percentages of CPU and memory use, disk throughput rate, rate at which disk commands are issued, and the rate at which data packets are sent to and received from the network.

This view shows the physical memory utilization summary for the selected component, broken into the amounts of memory that is swapped to disk, actively used, and allocated, all during a selected time period.

This view shows the network utilization summary for the selected component, including the average rate of network throughput, and the amounts of data sent to and received from the network.

Processes tab

This tab is available in the VMware Explorer. To find it, open the VMware Explorer and on the Virtual Infrastructure view, that appears on the navigation panel, select a Virtual Center, ESX® host, or virtual machine instance. In the VMware Explorer, open the Processes tab.

This tab only appears when you are exploring individual Virtual Centers, ESX hosts, and virtual machines, and have the Cartridge for Guest Processes Investigation installed and active. It displays an organized view of process information gathered by the Cartridge for Guest Process Investigation from the virtual or physical machine configured to send process information. When you open this tab, the process information for the selected server or virtual machine appears, allowing you to view the current CPU, memory, and monitored process statistics.

Figure 43. Processes tab

For complete information about the views that appear on this tab, see the Investigating Guest Processes User and Reference Guide.

Quick View

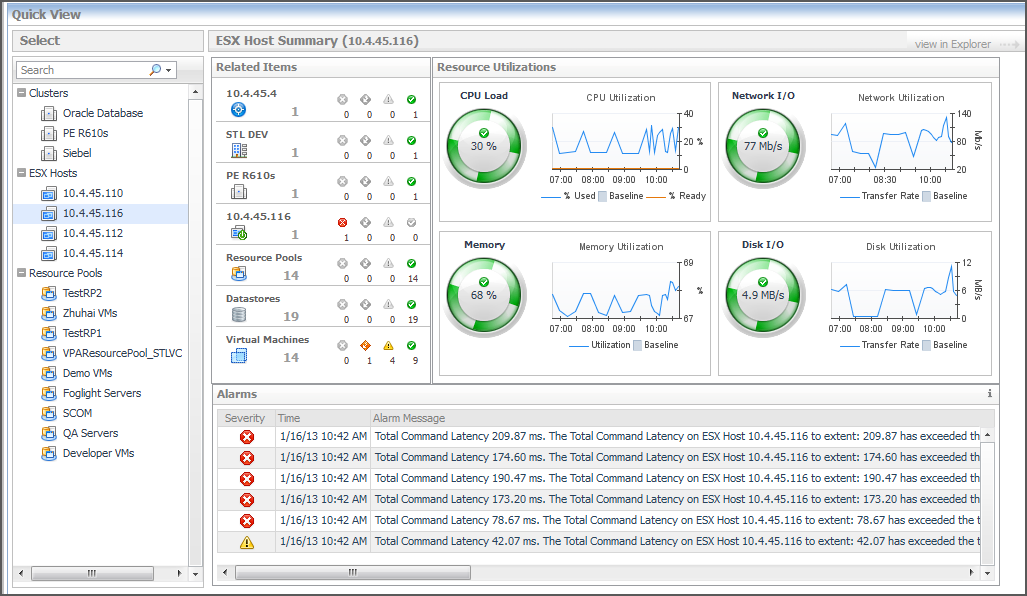
The Quick View appears in the middle of the VMware View Environment dashboard. For more information about this dashboard, see Use the VMware View Environment dashboard.

The Quick View displays summary information about the objects you select from the VMware View Environment Details tab.

Figure 44. Quick View

The Quick View is made up of two embedded views: the Object Tree view and the Object Summary view. Depending on what is displayed in the Object Tree view, the Object Summary view, located at the right of the Quick View, displays summary information for either a single object or for a group of objects of a particular type.

The Quick-View is made up of the following embedded views:

The Object Tree view is located at the left of the Quick View and displays objects based on what is selected on the tiles of the VMware View Environment dashboard.

Depending on what is displayed in the Object Tree view, the Object Summary view displays summary information for either a single object or for a group of objects of a particular type.

If the Object Tree view is displaying a list of objects of a particular type, you can click an object in the list to have the Object Summary view display summary information for that object.

The Object Summary view is located at the right of the Quick View and displays summary information for a single object or for a list of objects, depending on what is displayed in the Object Tree view.

The Object Summary view can display a number of embedded views (such as a Top Consumer view, an Inventory view, a Resource Utilizations view, and an Alarms view). The views the Object Summary view displays depend on the object or list of objects for which the Object Summary view is providing information.

When viewing information about a single object, the Object Summary view consists of an Inventory view and a Resource Utilizations view.

The Inventory view shows all of the objects related to the object selected in the Object Tree view, along with their respective alarm state counts. All objects in the object relationship hierarchy, including the selected object, are shown in the Inventory view, so that you see the entire relationship hierarchy for the selected object. Each level in the hierarchy is labelled with the corresponding object type name. When there is only one object at a particular level in the hierarchy, the object name is displayed instead of the object type name.

When the Inventory view shows multiple objects for a particular object type, you can click the object type icon, the object type name, or the object count to view a popup that displays a complete list of the objects, along with their respective states.

Related Objects views

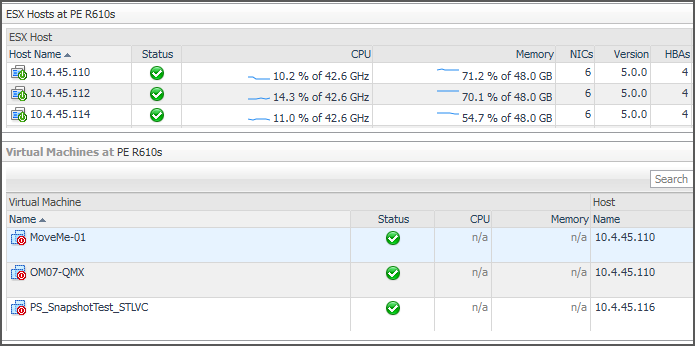
At least one Related Objects view is provided in the VMware Explorer dashboard.

Related Objects views are part of the VMware Explorer Primary view and are typically located at the bottom of the Primary view. More than one Related Objects view may appear at a time.

Related Objects views provide summary information on either the parent or child objects or both (whichever is applicable) of the object being viewed in the dashboard.

Related Objects views differ from each other and may not appear at all depending on the object or collection of objects selected from the Virtual Infrastructure view and on the navigation tab selected from the VMware Explorer Primary view heading.

Related Objects views for an individual object display tables that list either the parents or descendents or both (whichever is applicable) of the selected object and provide pertinent summary details about each one. The Related Objects view for a collection of objects displays a table that lists all of the objects in the selected collection and provides pertinent summary details about each one. You can sort Related Objects view tables by a particular column by clicking the corresponding column heading. If you select an object from the table by clicking on one of the table rows, all of the views in the VMware Explorer dashboard get updated with information about that object.

Verwandte Dokumente

The document was helpful.

Bewertung auswählen

I easily found the information I needed.

Bewertung auswählen