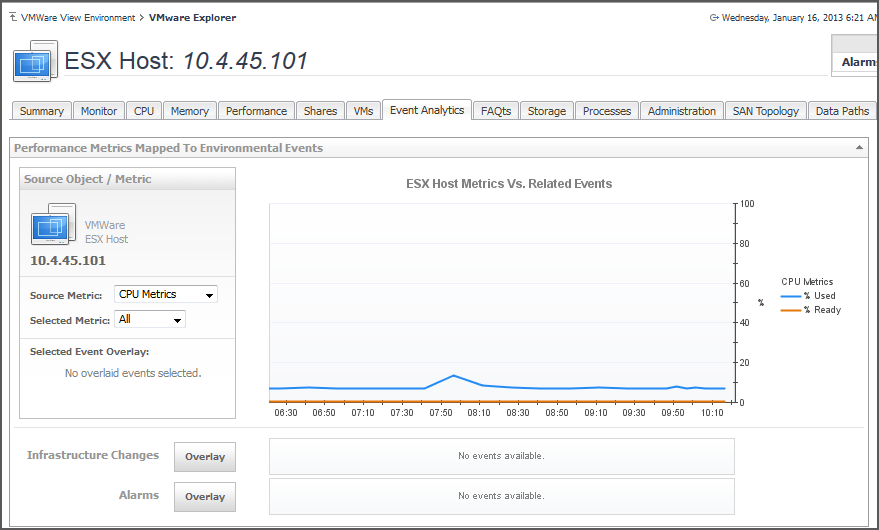
This tab is available in the VMware Explorer. To find it, open the VMware Explorer and on the Virtual Infrastructure view, that appears on the navigation panel, select an ESX® host or virtual machine instance. In the VMware Explorer, open the Event Analytics tab.
VMware Explorer’s Event Analytics tab contains details about the state of resource-related metrics collected about an ESX host or a virtual machine over a selected time period, and also shows any events that occurred during that time frame.
This view is made up of the following embedded views:
This view shows a chart indicating the utilization percentage or all values for one or more metric values selected in the Source Object/Metric view. If any infrastructure changes occur for the selected server during the selected time period, you can add them as an overlay to the chart using the Infrastructure Changes and Alarms view. This can give you a good idea on how the current resource consumption affects your environment as a whole. For example, a steady increase in memory consumption can trigger memory utilization alarms, which typically indicates that you need to allocate more memory to the affected ESX Server.
This view allows you to add events such as alarms or infrastructure changes as overlays to the ESX Host Metrics Vs. Related Events or VM Metrics Vs. Related Events view, and correlate the resource consumption with the stability of your environment.
This view shows a chart indicating the utilization percentage or all values for one or more metric values selected in the Source Object/Metric view. If any infrastructure changes occur for the selected server during the selected time period, you can add them as an overlay to the chart using the Infrastructure Changes and Alarms view. This can give you a good idea on how the current resource consumption affects your environment as a whole. For example, a steady increase in memory consumption can trigger memory utilization alarms, which typically indicates that you need to allocate more memory to the affected virtual machine.
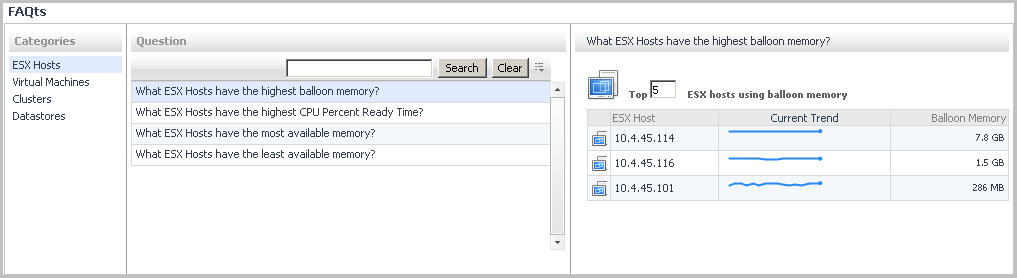
The FAQts view is made up of the following embedded views:
|
• |
This view provides an answer to the question selected in the Questions view. The answer appears in the following form:
Top x <objects of category>…
where x is the number of objects of the category you provided in the Categories view.
Specify x by entering a number. The answer is relative to the subset of the infrastructure you are viewing in the dashboard. For example, the top 5 datastores are different for each individual cluster in the infrastructure.
This view lists the categories for which questions can be answered for you by Foglight for Hyper-V.
Click a category in the list to select it.
This view lists the questions, for the category selected in the Categories, that can be answered for you by Foglight for Hyper-V.
Click a question in the list to select it.
If the list of questions is long and you want to narrow it down, search for a particular text string using the Search Questions box.
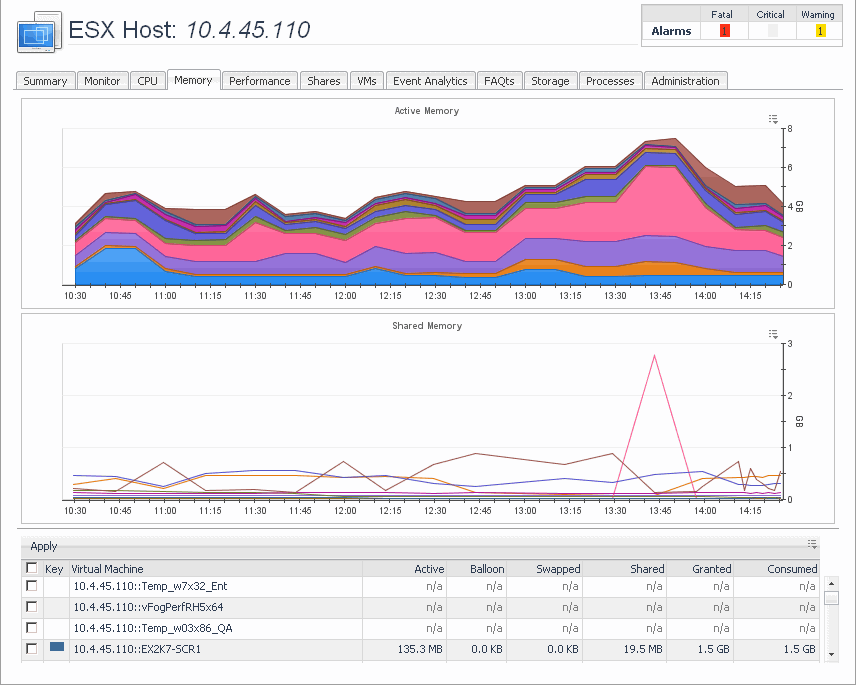
This tab is available in the VMware Explorer. To find it, open the VMware Explorer and on the Virtual Infrastructure view, that appears on the navigation panel, select an ESX® host instance. In the VMware Explorer, open the Memory tab.
The VMware Explorer’s Memory tab displays the combined memory utilization for an ESX host, showing the amount memory used by each virtual machine that is running on that host. This includes the amount of active and shared memory in GB, all during a selected time period.
This view is made up of the following embedded views:
This view shows a list of all virtual machines that are running on the selected ESX host. For each virtual machine, it shows its name along with a color indicator for displaying this information in the Active Memory and Shared Memory views. This allows you to show or hide the related resource use from these views.
The list also shows the following information for each virtual machine:
|
• |
Active. Amount of physical memory that is actively being used. |
|
• |
Balloon. Amount of memory being used by the VMware® Memory Control Driver to allow the virtual machine OS to selectively swap memory. |
|
• |
Consumed. Amount of memory that is consumed by current processes. |
|
• |
Granted. Total amount of memory that is allocated to the virtual machine. |
|
• |
Shared. Amount of memory that is freed up on the host due to transparent page sharing. |
|
• |
Swapped. Amount of memory that is stored in disk swap space. |
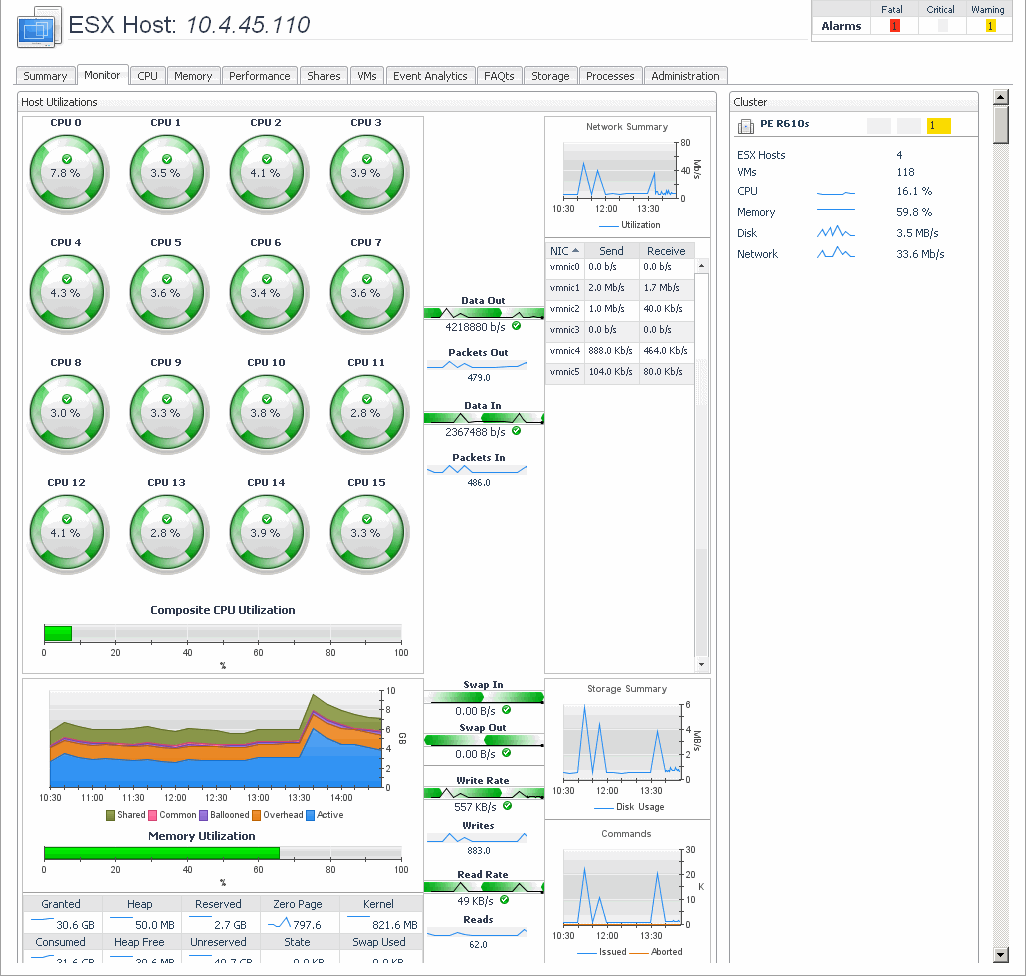
This tab is available in the VMware Explorer. To find it, open the VMware Explorer and on the Virtual Infrastructure view, that appears on the navigation panel, select the server or virtual machine instance. In the VMware Explorer, open the Monitor tab.
The VMware Explorer’s Monitor tab shows details of system resources consumption for a server or a virtual machine.
This view is made up of the following embedded views:
|
• |
|
• |
This view shows a list of messages associated with the selected virtual machine.