Getting Started to Set Up and Administer Monitoring Agents
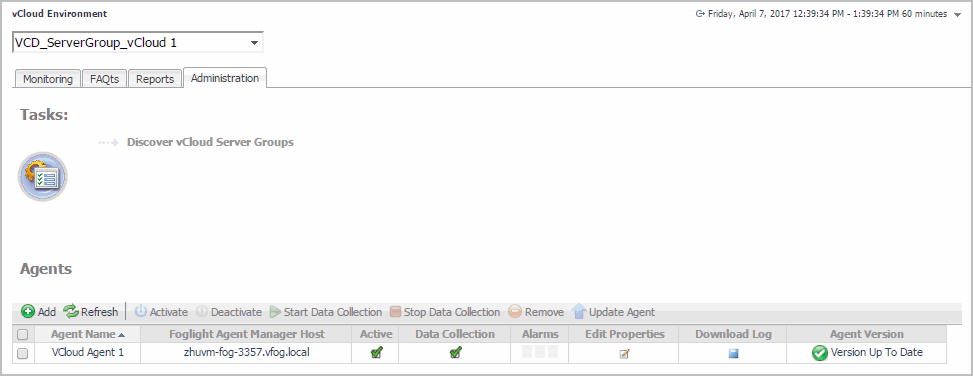
Foglight™ for vCloud Director includes a set of dashboards that allow you to monitor your virtual environment and manage monitoring agents. The vCloud Environment dashboard consists of several tabs, each focusing on a specific aspect of your monitoring needs. The Administration tab
To access this tab, on the navigation panel, under Dashboards, choose vCloud Director > vCloud Environment, and then open the Administration tab.
Exploring the Available Tasks
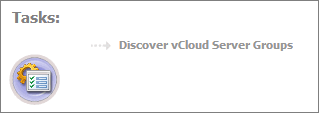
The Tasks area contains a link to the vCloud Discovery Wizard, Discover vCloud Server Groups. You can use this wizard to find a vCloud server group and the related cells in your environment. For more information, see Discovering Server Groups.
Exploring the Agents table
The Agents table lists the existing agent instances and allows you to manage them. It contains a set of columns that indicate various states of individual agent instances, along with several commands that you can issue to manage them. For example, to see if an agent instance is collecting data, look at the agent’s Data Collection column. A green check mark indicates that the agent is collecting data.
|
The name of the machine on which the Agent Manager process is running. | |
|
Indicates if the agent is collecting data from the monitored environment. | |
Exploring the toolbar
The toolbar appearing on top of the Agents table provides a set of commands that allow you to manage agent instances. To issue any of the available commands, simply select one or more agent instances using the check boxes in the left-most column, and click the appropriate button on the toolbar. For example, to start an agent’s data collection, select the agent and click Start Data Collection.


